
The digital asset landscape is currently gripped by a compelling, albeit polarizing, debate surrounding the performance of Ethereum (ETH) relative to the market’s primary benchmark, Bitcoin (BTC). As of late June 2026, the ETH/BTC ratio has plummeted to 0.027—a level not seen since the nascent stages of the 2023 market recovery. This significant drawdown from the 2021 cycle peak of 0.088 has ignited a fierce discourse among analysts: does this represent an generational buying opportunity, or is Ethereum suffering from a terminal structural decline?
The Core Data: A Relative Performance Crisis
The current valuation of Ethereum, when denominated in Bitcoin, is objectively at a multi-year low. Market participants who track the ETH/BTC ratio—a key indicator of investor risk appetite and liquidity rotation within the crypto ecosystem—are highlighting a divergence that suggests a profound shift in capital allocation.
In 2021, at the zenith of the previous bull cycle, the ratio sat comfortably near 0.088. Today, at 0.027, the ratio has effectively been cut by more than two-thirds. To the value-oriented investor, this metric screams "undervalued." To the trend-follower, however, it serves as a glaring red flag.
The primary question remains: is the current weakness a result of irrational market sentiment, or is it a reflection of fundamental shifts in the smart-contract sector? As Bitcoin continues to solidify its position as a "digital reserve asset," Ethereum finds itself struggling to maintain its narrative of "digital oil" in a market that is increasingly favoring simplicity and store-of-value characteristics over complex utility-driven chains.
Chronology of the Current Downtrend
The recent price action in the Ethereum market has been defined by a series of failed recovery attempts. Below is a timeline of the technical developments leading up to the current market configuration:
- Q1 2026: Ethereum entered the year with optimistic momentum, but struggled to break through resistance levels established in the previous year.
- May 2026: Market volatility began to favor Bitcoin, as institutional inflows into Bitcoin spot products consistently outpaced those directed toward Ethereum-based vehicles.
- June 15, 2026: Technical indicators on the weekly charts began to signal a breakdown in market structure as ETH failed to hold critical support levels against both the USD and BTC.
- June 20, 2026: Analyst "Woetoe" highlighted the 0.027 ratio, formalizing the narrative that Ethereum has reached an inflection point. Simultaneously, analysts at SwallowAcademy identified a bearish correction pattern on the ETHUSDT pair following a deceptive "strong weekly open."
Technical Analysis: The Case for a Bearish Correction
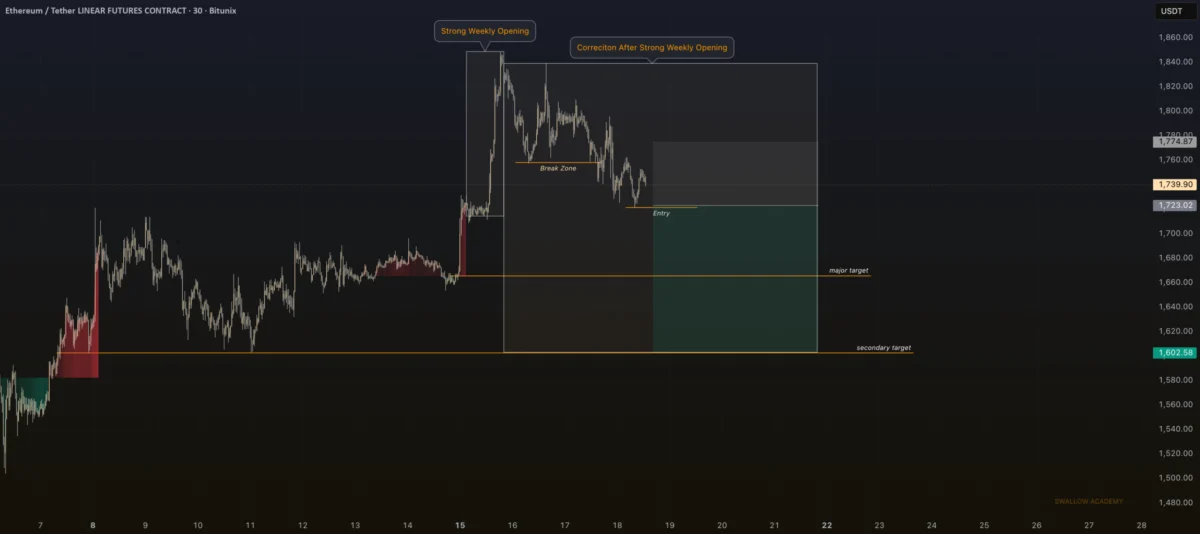
Beyond the relative-value debate, the dollar-denominated chart for ETH (ETHUSDT) presents its own set of challenges. According to analysis from SwallowAcademy, the recent price action exhibits all the hallmarks of a "bull trap."
The market witnessed an aggressively strong weekly open that promised a breakout; however, the lack of follow-through buying pressure allowed the price to roll over beneath the $1,774 psychological ceiling. This failed breakout is significant because it indicates a exhaustion of bullish liquidity.

The prevailing technical strategy being discussed by traders involves a "sell the retest" framework. With the price failing to sustain levels above $1,774, the bearish thesis targets an entry zone around $1,723, with a further downside target of $1,660. The logic here is that the market requires a deeper, more painful rebalance to clear out leveraged long positions before any sustainable, long-term trend can be established.
Supporting Data and Market Dynamics
To understand why the ETH/BTC ratio is at its current levels, one must look at the broader macroeconomic environment and the internal mechanics of the Ethereum network.
1. Capital Rotation
Institutional capital is notoriously risk-averse. During periods of uncertainty, capital tends to consolidate in the asset with the highest liquidity and the most recognized brand—Bitcoin. Ethereum, while technically superior in terms of utility, is perceived as a "higher beta" asset. When the market turns sour, capital flees higher-beta assets for the safety of the flagship.
2. Network Utility vs. Speculative Demand
Ethereum’s deflationary mechanisms (EIP-1559 and staking rewards) were intended to create a supply shock that would bolster the price. However, if on-chain activity on Layer 2 solutions and decentralized applications (dApps) fails to reach a critical mass, the deflationary effect is insufficient to offset the selling pressure from miners, validators, and profit-takers.
3. The "Store of Value" Narrative
Bitcoin’s success as a "digital gold" has been reinforced by its limited supply and decentralized consensus. Ethereum’s pivot to Proof-of-Stake has indeed made it more environmentally friendly, but some investors argue it has muddied the waters regarding its regulatory status and its identity as a "money" asset compared to the simplicity of Bitcoin.
Institutional Perspectives: The Silence of the Bulls
While retail sentiment is currently dominated by fear and uncertainty, institutional players are remaining notably quiet. Major asset managers have not publicly altered their long-term thesis on Ethereum, suggesting that the current price action is viewed as a "noise" event rather than a fundamental shift in the project’s viability.
However, the lack of a strong institutional defense for the current price levels is telling. Professional investors are likely waiting for a "capitulation event"—a moment of maximum pessimism—before deploying fresh capital. In the world of finance, "cheap" is not a reason to buy; a reversal in the trend is. Institutional desks are likely looking for a weekly close above the $1,800 level to confirm that the "structural decline" narrative has been invalidated.

Implications: Contrarian Bet vs. Structural Decline
The implications for investors are stark, depending on their time horizon and risk tolerance.
The Contrarian Argument
Proponents of this view argue that markets are emotional and prone to overreaction. By treating the 0.027 ratio as a "mean reversion" opportunity, they believe that Ethereum is currently "on sale." History has shown that when an asset becomes universally disliked and technically "broken," it is often in the final stages of a bottoming process. If the macro environment turns bullish, Ethereum’s high-beta nature could see it outperforming Bitcoin exponentially.
The Structural Decline Argument
The opposing view suggests that Ethereum is facing a crisis of relevance. With competition from high-throughput blockchains and the ongoing maturation of Bitcoin’s Layer 2 ecosystem, Ethereum’s "moat" is no longer as wide as it once was. If the ETH/BTC ratio fails to reclaim the 0.040 level, the long-term trend suggests that Ethereum may continue to bleed value against Bitcoin for the foreseeable future.
Conclusion: The Path Forward
The situation surrounding Ethereum is a classic case study in market psychology. We are witnessing a divergence between the technical reality of a bearish trend and the valuation argument of a "cheap" asset.
For the short-term trader, the technical evidence is clear: the path of least resistance is downward, and the focus should be on the $1,660 support zone. For the long-term investor, the focus must shift from price action to fundamental developments.
Whether Ethereum is undergoing a structural decline or merely a painful correction, one thing is certain: the market is demanding proof of value. Until Ethereum can demonstrate a clear, undeniable advantage that drives sustained demand, it will likely remain under the shadow of Bitcoin’s dominance. Investors would do well to watch for a "reclaim" of key levels—a signal that the bulls have finally returned to defend their territory. Until then, the ETH/BTC ratio will continue to serve as the most important thermometer for the health of the broader cryptocurrency market.
