
The cryptocurrency market continues to exhibit high volatility, with XRP, the digital asset native to the Ripple ecosystem, currently standing at a critical technical juncture. Following a period of steady upward momentum, XRP has successfully breached the $1.1650 resistance level, signaling a potential shift in market sentiment. As of the latest trading sessions, the asset is undergoing a consolidation phase, with investors and analysts closely monitoring its ability to sustain current gains and challenge the formidable $1.20 resistance zone.
Main Facts: The Current Market Landscape
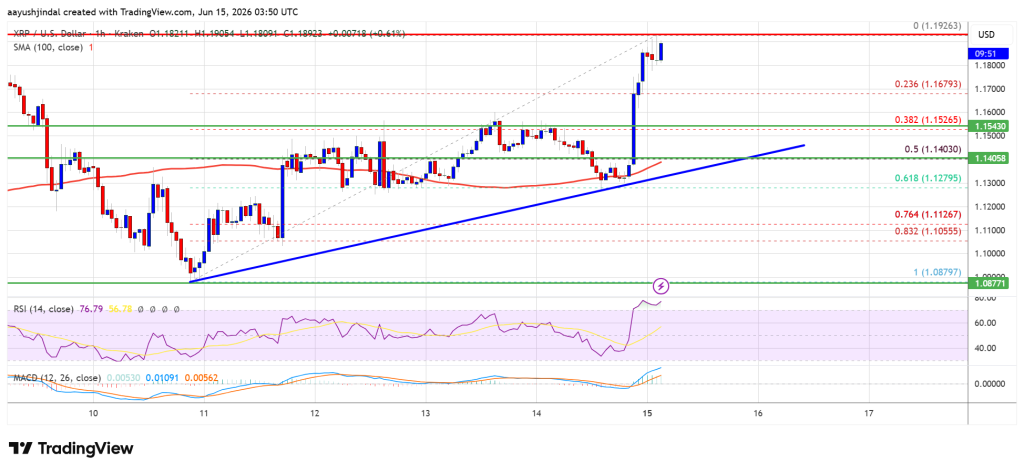
XRP’s recent price action has mirrored broader trends seen in market leaders like Bitcoin and Ethereum. After climbing from a swing low of approximately $1.0879, the asset displayed significant strength, clearing major hurdles at $1.1450 and $1.1680. This move was characterized by a surge in buying pressure, which briefly pushed the price to an intraday high of $1.1926.
Currently, the asset is trading firmly above the $1.180 support level and maintains its position above the 100-hourly Simple Moving Average (SMA). This positioning is widely considered a bullish signal by technical analysts, suggesting that the underlying trend remains constructive in the short term. The formation of a bullish trend line on the hourly XRP/USD chart—providing support near the $1.140 level—further reinforces the narrative that the bulls are currently in control of the near-term price discovery process.
Chronology of the Recent Rally
To understand the current market position, it is essential to trace the recent trajectory of XRP:

- The Foundation Phase: The asset spent a considerable amount of time trading in a consolidation pattern near the $1.08 to $1.10 range, establishing a solid base for the subsequent breakout.
- The Breakout: Triggered by increased volume and positive market sentiment across the crypto sector, XRP began its climb, decisively breaking through the $1.1450 ceiling.
- The Resistance Test: As the price approached the $1.19 level, market participants began to lock in profits, leading to the current consolidation.
- The Retracement Check: The price held steady above the 23.6% Fibonacci retracement level of the move from the $1.0879 low to the $1.1926 high, indicating that the selling pressure remains controlled rather than panic-driven.
Supporting Technical Data
The technical outlook for XRP is supported by several key indicators that provide context for its current state:
- MACD (Moving Average Convergence Divergence): The hourly MACD for the XRP/USD pair is currently gaining momentum within the bullish zone. This indicates that the buying volume is currently outpacing selling pressure, providing a tailwind for potential upward movement.
- RSI (Relative Strength Index): The RSI is currently hovering above the 50 level. This is a neutral-to-bullish territory, suggesting that while the asset is not yet "overbought," it possesses sufficient upward room to continue its climb without an immediate risk of a pullback.
- Fibonacci Retracement Levels: Analysts are keeping a close eye on the 50% retracement level of the recent rally. Should the price face a deeper correction, this level, coinciding with the $1.1400 support zone, will be the ultimate litmus test for the long-term bullish trend.
Navigating Potential Scenarios
The path forward for XRP is bifurcated between two primary scenarios: the continuation of the bull run or a necessary technical correction.
The Bullish Case: Targeting the $1.20 Milestone
For the bulls to maintain dominance, a sustained close above the $1.1920 resistance is paramount. Once this hurdle is cleared, the $1.20 level acts as the next major psychological and technical barrier. A successful flip of this level from resistance to support would likely invite further institutional interest, potentially setting the stage for a push toward $1.2150 and eventually the $1.2220 mark. Beyond this, the $1.2250 level represents a significant supply zone where sellers have historically been active.
The Bearish Case: Risk of Downside Correction
Conversely, failure to clear the $1.20 zone could lead to a swift downside correction. If the price slips below the $1.1680 support, the focus shifts to $1.1550. A break below this point would signal a weakening of the current structure, potentially inviting a slide toward the $1.1400 support—the critical trend line mentioned previously. If that level fails to hold, the asset could see a more pronounced correction toward $1.1280 or even the $1.1120 mark, with $1.08 serving as the final line of defense for the broader uptrend.
Implications for Investors
The current consolidation in XRP is typical of high-beta assets that have experienced rapid gains. For investors, this period of "choppy" price action often serves as a filter between short-term speculators and long-term holders.
The primary implication of this move is that XRP is attempting to re-establish a higher floor for its next cycle. If the asset can successfully hold the $1.1680 level, it confirms that the market has accepted these higher prices as the new "normal," effectively raising the support baseline for future rallies. However, traders must remain cautious; market volatility often results in "fake-outs," where the price briefly breaches a level before reversing sharply. Utilizing stop-loss orders and maintaining a disciplined risk management strategy is essential during these periods of uncertainty.
Broader Market Context and Expert Perspective
Financial experts and seasoned traders, such as Aayush Jindal, emphasize that technical analysis must be viewed within the context of the broader market environment. XRP’s performance is rarely isolated; it is deeply intertwined with the regulatory clarity surrounding Ripple Labs and the overall health of the global cryptocurrency market.
As the industry matures, the intersection of software engineering and financial trading—a domain Jindal frequently highlights—has become increasingly important. The use of algorithmic trading and automated technical analysis tools has made price discovery faster and more efficient, meaning that resistance and support levels are often tested with more vigor than in previous market cycles.
Investors should remember that while indicators provide a roadmap, they do not guarantee outcomes. The crypto market remains susceptible to news-driven events, regulatory updates, and sudden shifts in global macroeconomic policies.
Disclaimer
The information provided in this article is for educational purposes only and should not be construed as financial, investment, or legal advice. Cryptocurrency trading involves substantial risk of loss and is not suitable for every investor. The analysis provided reflects technical chart interpretations and market conditions at the time of writing. Market conditions can change rapidly, and users are encouraged to conduct their own thorough research and consult with a certified financial advisor before making any investment decisions. The publisher assumes no responsibility for any financial losses or damages resulting from the use of this information.
