

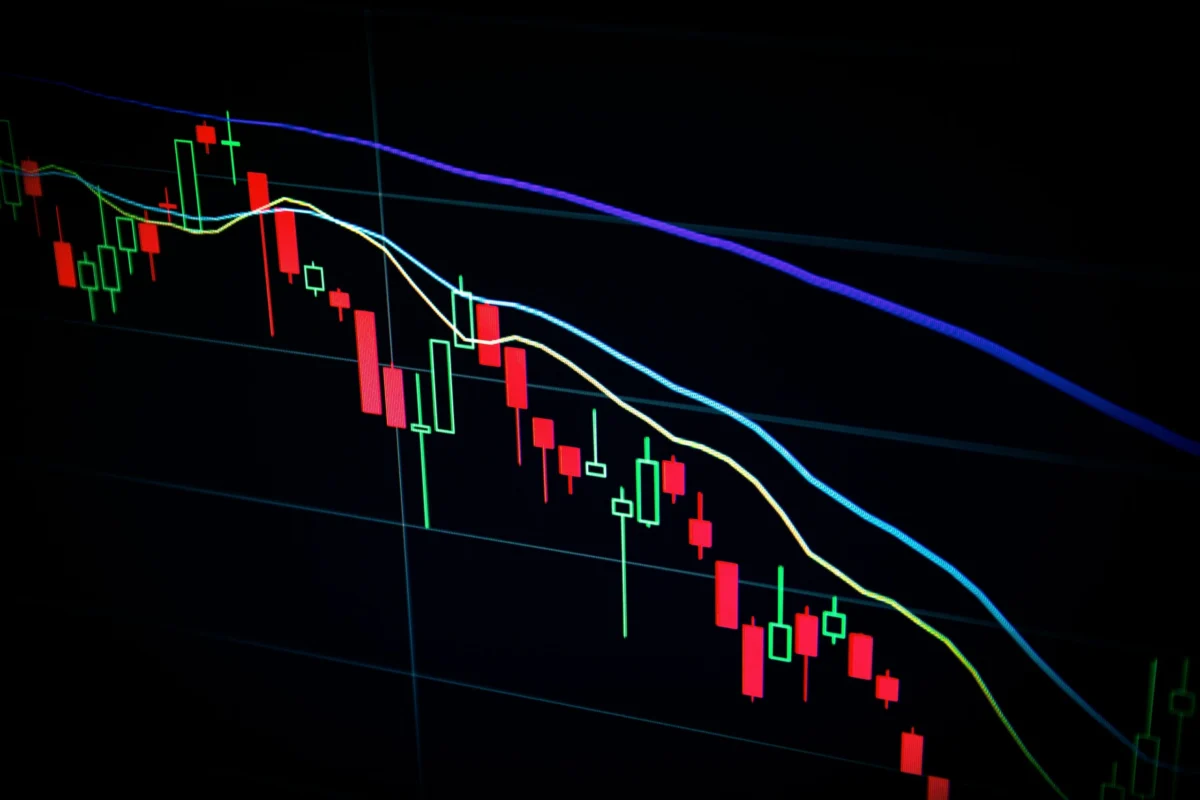
In the high-stakes theater of cryptocurrency, Bitcoin’s recent attempt to stabilize around the $59,000 mark has become a focal point for institutional investors and retail traders alike. While a price point may appear as a simple line on a chart, the current recovery attempt represents a critical stress test for market depth following a turbulent period defined by government-led liquidations, shifting ETF demand, and a broader erosion of global risk appetite.
As the market attempts to find its footing, the narrative has moved beyond mere price action. It is now a complex interplay of on-chain data, macroeconomic uncertainty, and the relentless pursuit of liquidity.
Main Facts: The Anatomy of the Current Rebound
At the heart of the current market discourse is the $59,000 to $60,000 resistance zone. This area has evolved into a psychological and technical barrier, acting as a "no-man’s land" where supply-side pressure—largely fueled by the liquidation of government-seized assets—collides with the absorption capacity of institutional buyers.
The volatility observed over the last several weeks has been driven by a "perfect storm" of factors:
- Supply Overhang: Large-scale movements from government wallets have triggered bouts of selling pressure, forcing the market to absorb significant volume.
- ETF Flow Dynamics: The appetite of Spot Bitcoin ETFs, once the primary engine of the 2024 bull run, has become more selective, reflecting a more cautious stance from institutional allocators.
- Liquidity Fragmentation: As global interest rate expectations shift, liquidity in the crypto markets has become fragmented, making it harder for assets to maintain momentum without significant buying volume.
The current move toward $59,000 is not merely a recovery; it is a search for "cleaner" price action—a scenario where buyers demonstrate sufficient conviction to clear out the existing supply overhang without triggering further capitulation.
Chronology: A Timeline of Recent Volatility
To understand why the $59,000 level is significant, one must trace the events that led the market here.
- The Early Q3 Sell-off: The market entered a period of heightened sensitivity as reports of government-controlled wallets—specifically those linked to historical asset seizures—began moving Bitcoin to exchange addresses. This sparked fears of immediate market dumping, leading to a sharp correction from the $65,000+ range.
- The ETF Stabilization Phase: Following the initial shock, Bitcoin experienced a period of consolidation. During this time, Arkham Intelligence data began highlighting the granular movement of these "whale" entities, providing traders with real-time insight into potential sell-side pressure.
- The Mid-August Correction: As broader equity markets showed signs of strain, the crypto market saw a temporary dip into the low $50,000s. This period tested the resolve of long-term holders.
- The Current Rebound (Late August): Bitcoin successfully reclaimed the $57,000 level and began testing the $59,000 barrier. This recovery is characterized by a cautious return of volume, as participants wait for further confirmation before committing to a directional trend.
Supporting Data: Peering Into the On-Chain Landscape
The utility of modern crypto analysis lies in its transparency. Platforms like Arkham Intelligence have bridged the gap between raw blockchain data and actionable market intelligence. By tracking entity-specific wallets, analysts can now distinguish between "panic selling" from retail participants and "strategic distribution" from institutional entities.
The Role of On-Chain Tracking
Arkham-style entity tracking has become indispensable for framing the supply backdrop. When a government wallet initiates a transfer, the market no longer has to guess the source of the pressure; the data is public. This transparency reduces the "fear of the unknown," which is often more damaging to markets than the actual price drop.
Liquidity and Derivatives Positioning
Beyond wallet movements, the state of the derivatives market provides a secondary layer of data. Open Interest (OI) levels and funding rates at the $59,000 mark suggest that traders are currently hesitant to take aggressive long positions. A "clean rebound" would require:
- Funding Rates: A neutral to slightly positive funding rate, indicating that the market is not over-leveraged.
- Spot vs. Futures Premium: A shift where spot buying leads price action, rather than perpetual futures contract speculation.
Official Responses and Institutional Perspectives
While there is no single "spokesperson" for the Bitcoin market, the collective behavior of ETF issuers (such as BlackRock, Fidelity, and Bitwise) provides a proxy for institutional sentiment.
Recent commentary from these firms suggests a focus on "long-term accumulation." Despite the short-term volatility caused by government sales, the institutional view remains that Bitcoin’s macro thesis—as a hedge against fiat debasement—remains intact.
Furthermore, regulators are increasingly focusing on the "plumbing" of the crypto market. The focus has shifted from blanket bans to ensuring that exchange flows and custodial practices meet institutional standards. This transition, while creating friction in the short term, is widely regarded by industry leaders as the necessary foundation for the next wave of mass adoption.
Implications: What Traders and Builders Need to Know
For the average investor, the most dangerous approach is to treat the current price action as an isolated event. The $59,000 test is a diagnostic tool, not a prophecy.
The Danger of Headline-Driven Trading
A price level is not a guarantee. Treating a specific number as a "floor" ignores the reality that markets are dynamic systems. If the $59,000 level fails to hold, it may result in a "rejection area," leading to a retest of lower support levels. Conversely, if buyers absorb the supply, it signals a shift in market sentiment from fear to accumulation.
Why Context is King
The practical takeaway for NewsBTC readers is to synthesize the data:
- Regulatory Environment: Regulatory pressure remains a constant, but the market is becoming more adept at navigating it.
- Project Utility: In noisy market cycles, capital tends to gravitate toward projects that continue to ship updates and demonstrate real-world utility.
- Discipline: The current market environment rewards those who view crypto as a series of connected data points. By ignoring the noise and focusing on exchange flows, ETF demand, and derivatives positioning, investors can move beyond mere guessing.
Conclusion: Watching the Signal, Not the Noise
As Bitcoin tests the $59,000 threshold, the primary objective for the observer should be patience. Crypto markets are notorious for their rapid movements, but the most enduring signals are those that remain valid after the initial volatility fades.
The current development is a snapshot of an ongoing battle between buyers and sellers. It is not necessarily a turning point, but it is a data-rich environment that offers a window into the market’s underlying health. Whether this rebound manifests as a sustained rally or a temporary deviation depends on the market’s ability to absorb the remaining supply overhang.
For now, the focus should remain on the sources—like the data aggregated on the Arkham platform—and the broader market conditions. By maintaining a disciplined, fact-based approach, participants can better position themselves for the next phase of the cycle, regardless of which direction the price moves in the next few sessions.
Disclaimer: This article is for informational purposes only and does not constitute financial advice. Market data and analysis are based on information available at the time of writing, including insights from platform.arkhamintelligence.com. Always conduct your own research before making investment decisions.
Written by the News Desk. Edited by Samuel Rae.
