

The cryptocurrency market is currently navigating a period of heightened volatility, with major assets facing downward pressure. Among these, Solana (SOL), often hailed for its high-throughput architecture and burgeoning ecosystem, has recently encountered a significant technical setback. After failing to sustain its position above the $67 threshold, SOL has entered a corrective phase, prompting analysts and investors alike to reassess the short-term trajectory of the asset.
This report provides a comprehensive examination of the recent price action, the technical indicators shaping the current outlook, and the broader implications for the Solana ecosystem amidst a shifting macroeconomic landscape.
Main Facts: The Current State of SOL
As of the latest market observation, Solana (SOL) has experienced a notable retreat from recent highs. The asset, which had been attempting to establish a firm base above the $67 level, succumbed to broader market sentiment that has also affected heavyweight assets like Bitcoin and Ethereum.
The decline represents more than just a momentary dip; it reflects a struggle to maintain momentum following a period of attempted recovery. Currently trading below the $65 mark, Solana is testing the resolve of its bulls. The breach of the 100-hourly simple moving average (SMA) suggests that the short-term trend has tilted toward the bearish side. For investors, the focus has shifted from "at what point will it rally" to "at what point will the support hold?"
Chronology of the Decline
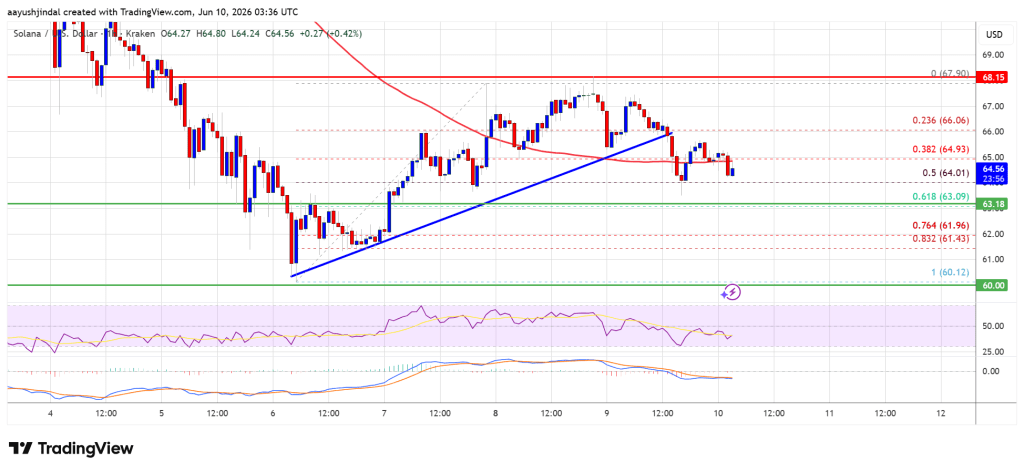
The recent price movement can be traced back to a specific series of technical failures. The downward trend began when the SOL/USD pair failed to maintain its bullish posture near the $67.90 swing high.

- The Rejection: After reaching a peak of approximately $67.90, the asset faced an immediate wall of selling pressure. The failure to sustain levels above $67 acted as a catalyst for a technical correction.
- The Breach: On the hourly charts, a vital bullish trend line—which had served as a foundation for the preceding rally—was decisively broken at the $66 support level.
- Fibonacci Retracement: The price action saw a clear drop below the 50% Fibonacci retracement level, measured from the $60.12 swing low to the $67.90 high. This move served as a signal to algorithmic traders and short-term speculators that the immediate upward momentum had exhausted itself.
- Testing the Floor: Following this breach, the price tested the $63.20 support zone, signaling a lack of strong buying interest at higher levels and a general migration toward the next tier of liquidity.
Supporting Data and Technical Indicators
To understand the mechanics behind the current price action, one must look toward the technical indicators that govern the behavior of the SOL/USD pair.
The MACD and Momentum
The Moving Average Convergence Divergence (MACD) indicator is currently showing clear signs of bearish acceleration. As the MACD line dips deeper into the negative territory, it suggests that the selling pressure is not merely a temporary anomaly but a trend that is gaining traction. This "gaining pace" in the bearish zone is a critical warning sign for traders looking to enter long positions.
RSI and Overbought/Oversold Conditions
The Relative Strength Index (RSI) for SOL/USD has fallen below the 50-level threshold. In technical analysis, an RSI below 50 indicates that the momentum of the asset is currently negative. As it trends downward, it signals that the market is currently favoring the bears, and unless a significant influx of volume enters the market to push the RSI back toward the 60-70 range, the path of least resistance remains to the downside.
Support and Resistance Levels
The structural integrity of Solana’s price is currently defined by these key levels:
- Immediate Resistance: The $65.00 mark serves as the first barrier, followed by the $66.00 and the critical $67.20 level. A successful, sustained close above $67.20 would be required to invalidate the current bearish narrative.
- Immediate Support: The $63.10 level is currently under siege. Should this fail, the 61.8% Fibonacci retracement level ($62.20) becomes the final line of defense before the price potentially seeks out the $60.00 psychological support zone.
Implications of the Current Market Structure
The current price action of Solana carries significant implications for the broader blockchain ecosystem. Solana has positioned itself as the "go-to" chain for decentralized applications (dApps), non-fungible tokens (NFTs), and high-frequency DeFi protocols. However, the price of the native token often acts as a proxy for the perceived health and adoption rate of the network.

1. Investor Sentiment
A sustained decline below $60 would likely trigger a wave of caution among institutional investors. While the long-term fundamentals of the Solana network remain robust—due to its low latency and transaction costs—market participants often conflate price stability with project maturity. A drop to the $55 range would represent a significant correction, potentially forcing developers and project founders to reconsider their deployment strategies if funding rounds are pegged to SOL price volatility.
2. Ecosystem Liquidity
Solana’s DeFi sector relies heavily on the liquidity provided by SOL-based pairs. As the price of SOL experiences a drawdown, the total value locked (TVL) in various protocols naturally declines, even if the number of staked tokens remains constant. This "price-induced" contraction can lead to a reduction in yield farming incentives, which in turn might cause a migration of capital toward more stable assets or other ecosystems, temporarily slowing down the network’s growth velocity.
3. Technical Development
It is worth noting that technical price movements often move independently of core protocol development. The Solana development team continues to push updates regarding network stability and scalability. Consequently, the current price dip may be viewed by some long-term believers as a "buying opportunity," provided that the project continues to hit its roadmap milestones regardless of the speculative volatility on exchanges.
Expert Perspective and Outlook
Market analysts often point out that cryptocurrency markets are notoriously cyclical. The current "slip" is consistent with broader market behavior observed in assets that have recently undergone rapid appreciation.
According to Aayush Jindal, a senior market expert with over 15 years of experience in financial markets, the key to navigating this volatility lies in disciplined analysis. "The market is a system of patterns," Jindal notes. "When we see a breach of the 100-hourly SMA coupled with a downward move in the RSI, it is an objective signal to re-evaluate risk exposure."
Jindal emphasizes that while the current data leans bearish, the market’s ability to "find a floor" is just as important as its ability to hit new highs. Investors are advised to watch the $60 support zone with extreme vigilance. A failure to hold this level could open the door to a more prolonged consolidation period, testing the patience of even the most committed long-term holders.
Conclusion
Solana (SOL) is currently at a crossroads. The recent failure to maintain the $67 level has introduced a period of technical uncertainty. While the short-term indicators suggest that the bears are in control, the crypto market is known for its sudden reversals.
For the average investor, the message is clear: the current environment is one that demands caution, rigorous risk management, and a focus on technical levels rather than emotional speculation. Whether Solana will find the necessary support to initiate another leg up or continue its descent toward $55 depends on a combination of broader macroeconomic factors, Bitcoin’s own stability, and the continued resilience of the Solana ecosystem.
As always, readers are reminded that the crypto market is highly speculative. Conduct your own due diligence, consult with financial advisors, and never invest more than you are prepared to lose. The path forward for SOL remains fluid, and the coming days will be critical in determining whether this is a minor correction or a shift in the medium-term market structure.
Disclaimer: The information provided in this article is for educational and informational purposes only. It does not constitute financial, investment, or legal advice. Investing in cryptocurrencies carries significant risk, and you should perform your own research before making any investment decisions. NewsBTC and its contributors are not responsible for any financial losses incurred based on the content of this report.
