

Executive Summary: Solana’s Price Trajectory
Solana (SOL), one of the most prominent layer-1 blockchain networks in the digital asset space, has recently encountered significant headwinds. After failing to sustain price levels above the $67 threshold, the asset has entered a period of corrective decline. This movement mirrors a broader trend observed across the cryptocurrency market, with major assets like Bitcoin and Ethereum also facing intensified sell-side pressure. As of the latest market sessions, Solana is trading below the $65 mark, testing critical support zones that will determine its short-term structural integrity. Traders and investors are currently scrutinizing the $63.00 level as a pivotal pivot point for potential recovery or further descent.
The Chronology of the Recent Downturn
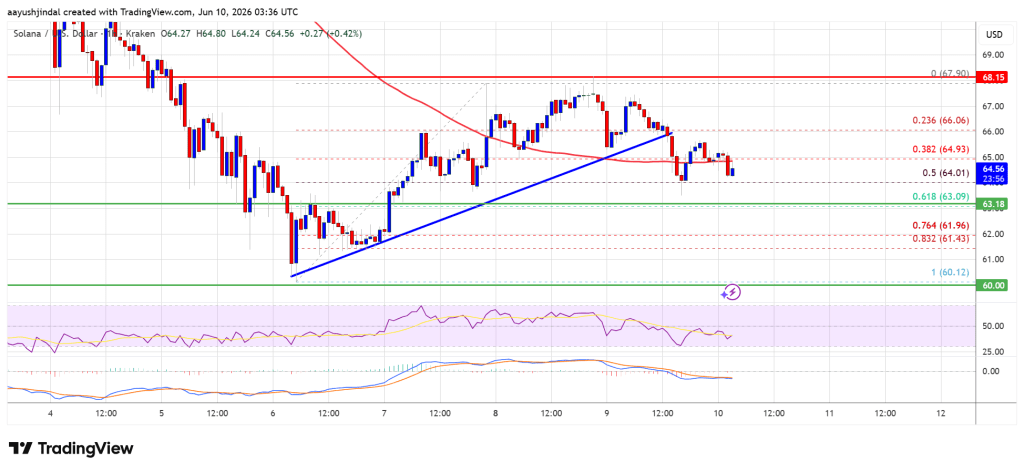
The recent price action for Solana can be categorized by a rapid transition from optimism to caution. Earlier this week, SOL exhibited signs of strength, pushing toward the $67.90 swing high. However, this momentum was short-lived.
- The Breakdown: The initial signs of weakness appeared when the asset failed to consolidate above the $67 resistance level. The subsequent breach of the 50% Fibonacci retracement level—calculated from the swing low of $60.12 to the recent high of $67.90—signaled a loss of bullish conviction.
- Trendline Violation: On the hourly chart, a critical bullish trendline was breached, with support previously holding at $66. Once this support level was compromised, the asset experienced a cascading effect, leading to a test of the $63.20 support level.
- Current Status: SOL is presently oscillating below the $65 level and remains trapped beneath the 100-hourly simple moving average (SMA), indicating that the short-term trend has shifted in favor of the bears.
Technical Foundations and Market Data
A rigorous technical examination of the SOL/USD pair reveals that the market is currently in a state of consolidation with a bearish bias.
Key Resistance Thresholds
- The $65.00 Barrier: This is the immediate hurdle. For the bulls to regain control, they must facilitate a clean break and retest of this level as support.
- The $66.00-$67.20 Zone: This area represents the next significant resistance. A sustained close above $67.20 is widely viewed by analysts as the prerequisite for a trend reversal that could target the $68 level and, subsequently, the $70 psychological ceiling.
Support Levels and Downside Risk
Should the market fail to find buyers at current levels, the downside risk becomes increasingly pronounced:

- The $63.10 Zone: Acting as a secondary support, this level correlates with the 61.8% Fibonacci retracement of the recent upward wave.
- The $62.20 Anchor: This is a crucial line in the sand. A decisive break below this point would likely invalidate any remaining bullish setups in the near term.
- The $60.00 Floor: Should the $62.20 support fail, the market will likely look toward the $60 support zone. A breakdown here could trigger a more aggressive sell-off toward $55, potentially attracting long-term value investors.
Indicators and Momentum
The technical indicators paint a cautionary picture for short-term traders:
- MACD (Moving Average Convergence Divergence): The hourly MACD for the SOL/USD pair is currently gaining momentum within the bearish zone, suggesting that selling pressure remains dominant.
- Relative Strength Index (RSI): The RSI is currently positioned below the 50 mark, reinforcing the sentiment that the asset lacks the immediate momentum required to launch a sustained rally.
Broader Implications: The Ecosystem Context
The price fluctuations in Solana do not occur in a vacuum. As a leading smart contract platform, Solana’s market value is deeply intertwined with its ecosystem’s health, including decentralized finance (DeFi) activity, non-fungible token (NFT) volumes, and developer adoption.
When SOL experiences sharp corrections, it often triggers liquidation events for leveraged traders across decentralized exchanges. Furthermore, a drop in the underlying token price can impact the Total Value Locked (TVL) within the Solana ecosystem, as the dollar value of collateralized assets diminishes.
However, historically, Solana has demonstrated high resilience. Its high-throughput, low-latency architecture continues to attract developers, even during periods of price stagnation. The current correction, while painful for short-term holders, is often interpreted by institutional analysts as a necessary consolidation phase after the sharp run-up from the $60.12 lows.

Expert Perspectives on Market Volatility
Senior market analysts suggest that the current volatility is largely macroeconomic in nature. With global interest rates and inflationary concerns continuing to impact risk-on assets, cryptocurrencies are currently highly sensitive to interest rate announcements and liquidity conditions.
"The current movement in SOL is indicative of a ‘wait and see’ approach from larger institutional players," noted market observers. "While the technical indicators suggest a bearish short-term trend, the underlying demand for Solana’s technology remains robust. The focus for traders should not just be on the price, but on whether the network maintains its volume and transaction throughput during these periods of volatility."
Navigating the Volatility: Strategies for Investors
For those operating within the cryptocurrency market, the following strategies are frequently employed during periods of downward correction:
- Risk Mitigation: Utilizing stop-loss orders is essential in a volatile environment where sudden spikes or drops can occur. Setting these around key technical support levels (like $62.20) can protect capital from extended drawdowns.
- Dollar-Cost Averaging (DCA): For long-term believers in the Solana project, the current price levels may offer an entry point. By laddering buy orders at $62, $60, and $55, investors can mitigate the risk of buying the "top" of a short-term bounce.
- Monitoring Ecosystem Metrics: Beyond price charts, keeping an eye on on-chain data—such as active wallet addresses, developer commit frequency, and decentralized application (dApp) usage—provides a more holistic view of whether the asset’s value proposition is being eroded or merely tested.
Conclusion: A Critical Juncture
Solana stands at a precarious juncture. While the immediate technical outlook is bearish, the asset has demonstrated the capacity for rapid recovery in the past. The ability of the bulls to defend the $62-$63 support range will be the deciding factor in whether the asset enters a period of extended consolidation or a deeper correction.
Investors are reminded that the cryptocurrency market is characterized by extreme volatility. As noted in the disclaimer, all financial decisions should be made with a clear understanding of the risks involved. Conducting independent research and maintaining a disciplined approach to portfolio management remain the most effective tools for navigating the unpredictable tides of the digital asset landscape.
Disclaimer: The information provided in this article is for educational and informational purposes only and does not constitute financial, investment, or trading advice. Investing in cryptocurrencies involves significant risks, including the potential loss of principal. NewsBTC does not recommend the purchase or sale of any specific asset. Readers are advised to conduct their own thorough research and consult with a qualified financial advisor before making any investment decisions. Use the information provided herein entirely at your own risk.
