

By the Financial News Desk
Edited by Samuel Rae
Main Facts
The narrative surrounding United States-listed spot Bitcoin exchange-traded funds (ETFs) has undergone a dramatic transformation. After months of enduring severe capital outflows and deep market pessimism, these regulated investment vehicles have officially wiped out a staggering multi-billion-dollar deficit.
As of late September 2026, U.S. spot Bitcoin funds have erased a deficit that peaked at approximately $5.8 billion in mid-July, pushing their cumulative net flows for the year back into positive territory at roughly $800 million. This represents an astonishing capital swing of more than $6 billion from the market’s lowest ebb earlier this summer.
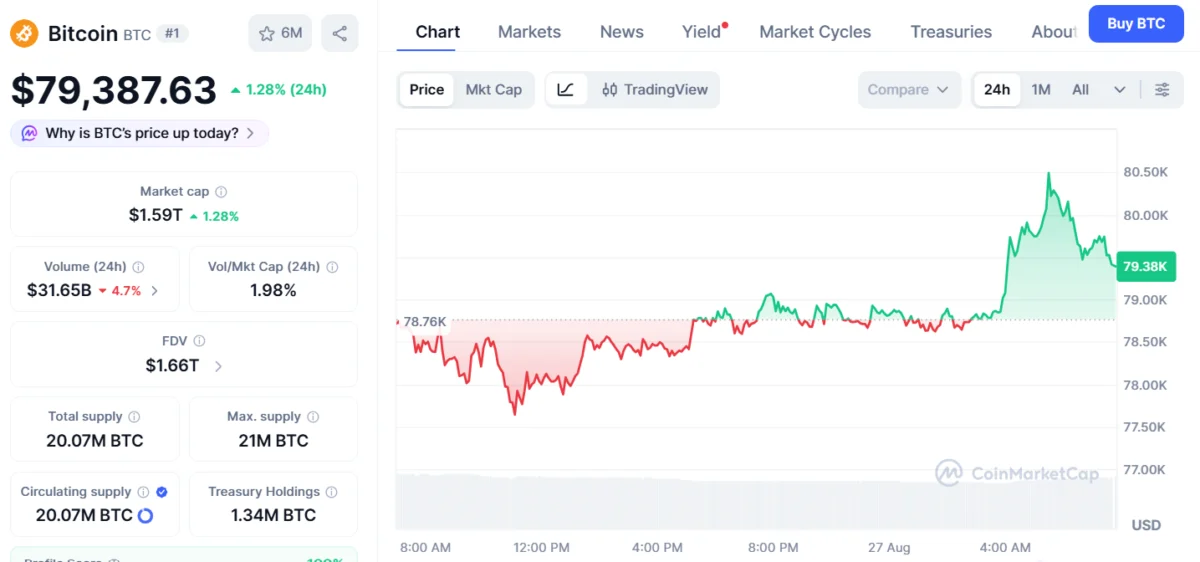
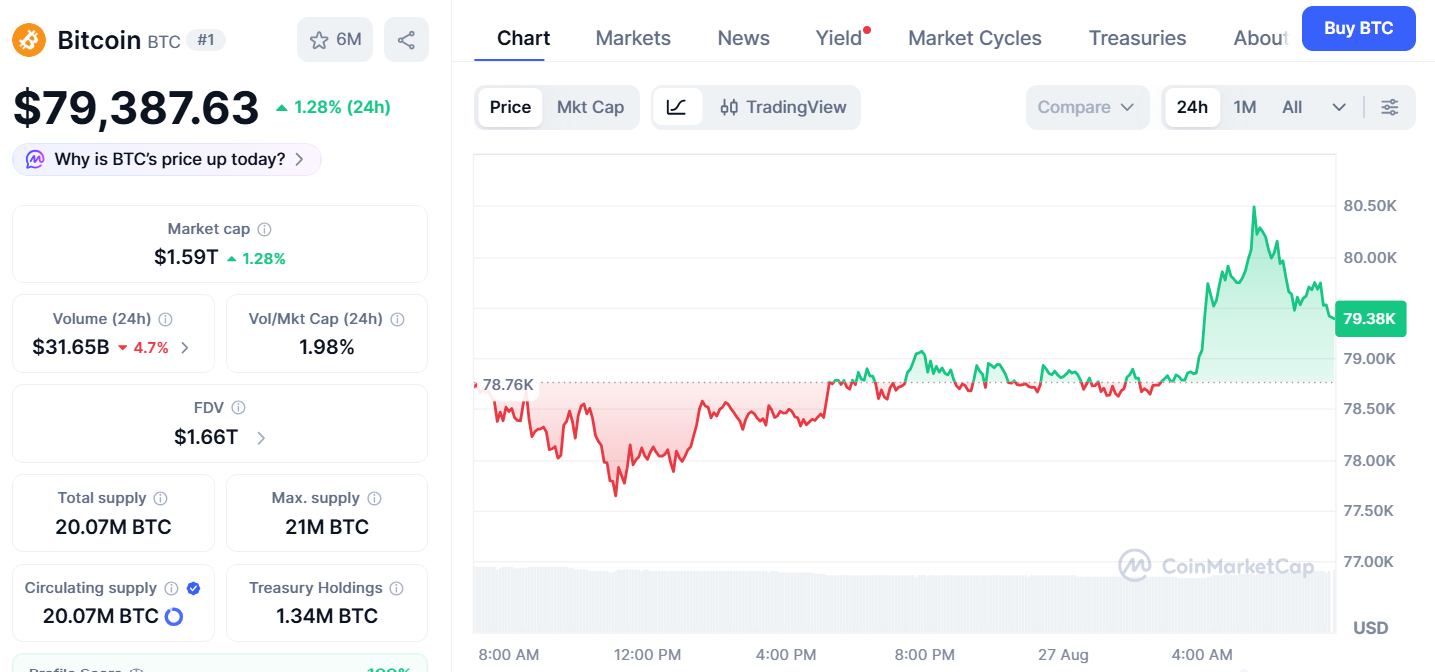
The turnaround was catalyzed by an intense six-day consecutive inflow streak that vacuumed up roughly $2.84 billion in fresh capital. This aggressive institutional accumulation coincided with a powerful macro-recovery for Bitcoin (BTC), which climbed out of a depressed sub-$58,000 valley in early June to reclaim the mid-$80,000 range.
While an annual net influx of $800 million remains modest when compared to the historic highs of 2024 ($35.2 billion) and 2025 ($21.4 billion), crossing back above the zero line serves as a vital psychological and structural milestone for the digital asset market. It signals that institutional appetite—often viewed as the lifeblood of the modern crypto economy—has returned with renewed conviction.
Chronology of a Turnaround: From Summer Outflows to Autumn Recovery
To understand the magnitude of the recent shift, one must trace the trajectory of the 2026 market, which began with mounting headwinds before exploding into a late-quarter renaissance.
Q1 – Q2 2026: The Deepening Deficit
The year 2026 did not start kindly for digital asset investors. Following the euphoric inflows of the previous two years, macroeconomic pressures—including sticky inflation, shifting Federal Reserve rate-cut expectations, and fluctuating bond yields—triggered a risk-off sentiment across traditional financial markets.
As Bitcoin’s price faced downward pressure, institutional investors systematically de-risked. For months, spot Bitcoin ETFs experienced persistent, grinding withdrawals. Day after day, capital bled out of the asset class, dragging cumulative annual flows deeper and deeper into the red.
July 13, 2026: The Nadir
The bleeding reached its maximum depth on July 13, 2026. By this date, cumulative net flows for the year hit a chilling negative $5.8 billion. Market sentiment was largely paralyzed; retail investors were cautious, and institutional desks were hesitant to deploy fresh capital into a falling knife. Bitcoin itself struggled below key technical thresholds, creating a feedback loop where falling prices triggered ETF outflows, which in turn put further downward pressure on the underlying asset.
Early June to September: The Price Rebound and Accumulation
The worm began to turn in early June, when Bitcoin found a definitive macro bottom below $58,000. As broader markets stabilized, dip-buyers stepped in, sparking a sustained upward trajectory that ultimately propelled BTC into the mid-$80,000 range.
As prices recovered, the psychological barrier holding back institutional capital began to crumble. Existing fund holders saw their underwater positions pivot into comfortable profits, while fresh risk models justified new allocations.
The Six-Day Inflow Surge
The defining moment of the reversal occurred over a condensed six-session window in late September. During this brief timeframe, market data confirmed an avalanche of capital into the sector, totaling approximately $2.84 billion.
Individual sessions underscored the sheer velocity of the move. For instance, data compiled by Farside Investors revealed that the September 24 session alone reeled in roughly $190.7 million in net inflows, with heavyweights like BlackRock’s iShares Bitcoin Trust (IBIT) leading the charge. By the end of this six-day blitz, the $5.8 billion hole had not only been patched—it had been completely erased, landing the market at a net-positive $800 million for the year.
Supporting Data and Market Metrics
A granular look at the data highlights the sheer scale of the turnaround and places the 2026 performance into historical perspective.
Comparative Annual Performance of U.S. Spot Bitcoin ETFs
| Year | Annual Net Inflows (Approximate) | Market Narrative |
|---|---|---|
| 2024 | $35.2 Billion | The launch era; massive pent-up demand and regulatory validation. |
| 2025 | $21.4 Billion | Maturation phase; steady institutional adoption despite macro volatility. |
| 2026 (YTD) | +$800 Million (Recovered from -$5.8B) | A tale of two halves: severe summer outflows followed by an aggressive autumn rebound. |
The Mechanics of the Recovery
- The Swing Magnitude: The transition from a negative $5.8 billion deficit to a positive $800 million surplus represents a net capital shift of $6.6 billion.
- Concentration of Issuers: While multiple issuers contributed to the streak, dominant liquidity providers like BlackRock (IBIT) continued to capture the lion’s share of inflows, proving that institutional investors heavily favor liquidity and brand familiarity when executing large-scale allocations.
- Price Correlation: The six-day streak directly mirrored Bitcoin’s breakout from the $58,000 floor to the mid-$80,000 ceiling. This validates the core thesis that rising spot prices act as a powerful marketing and allocation tool for ETF products, lowering the friction for portfolio managers seeking to justify crypto exposure to investment committees.
Official Responses and Industry Perspectives
While direct public relations statements from regulatory bodies remain muted regarding daily fund fluctuations, market makers, fund executives, and independent analysts have weighed in heavily on the structural implications of the 2026 market pivot.
The Institutional Desk Perspective
Speaking anonymously due to internal compliance policies, a senior derivatives trader at a major Wall Street prime broker noted that the return to positive territory alters client conversations entirely:
"When you’re sitting on a $5.8 billion deficit in mid-July, the conversation with risk committees is defensive. You are constantly defending why the asset class shouldn’t be pruned. Crossing back into the green changes the psychological framing. Suddenly, the narrative shifts from ‘capital flight’ to ‘re-accumulation.’ It gives portfolio managers the ammunition they need to re-engage."
Analyst Commentary on Macro Drivers
Independent market analysts have pointed out that the correlation between macroeconomic data releases and ETF flows remains tighter than ever. Commenting on the September rebound, a leading crypto-macro researcher observed:
"The summer drawdowns were largely a casualty of restrictive macro conditions and duration risk concerns. Now that the broader financial landscape is adjusting and Bitcoin has proven its resilience by bouncing off the high-$50k region, the ETFs are acting as the natural plumbing for institutional capital to rush back in. However, we must remain clear-eyed: these flows are elastic. If macro conditions sour, the exit doors are just as wide as the entrance."
Implications of the ETF Reversal
The wiping out of the 2026 deficit carries profound implications for the future of Bitcoin market structure, institutional adoption, and regulatory perception.
1. Psychological Validation and Momentum
In financial markets, perception often dictates reality. The fact that 2026 is no longer a "losing year" for spot Bitcoin ETFs removes a significant psychological barrier. For months, crypto skeptics and traditional financial media used the multi-billion-dollar deficit as evidence that the initial ETF hype was fading. By clawing back to a net-positive position, the asset class has demonstrated durability, proving that institutional capital is not merely transient tourist money that abandons the asset permanently during prolonged corrections.
2. The Nuance of "Positive"
Despite the celebratory tone surrounding the $800 million net inflow figure, market participants caution against over-exuberance. An $800 million annual intake, while a remarkable recovery from a $5.8 billion hole, is a far cry from the tens of billions captured in 2024 and 2025. This suggests that the market has transitioned from a hyper-growth adoption phase into a more cyclical, mature phase where capital flows are highly sensitive to price action, macroeconomic data points, and opportunity costs in traditional fixed-income markets.
3. Vulnerability to Macro Shifts
ETF flows provide a regulated, frictionless conduit for institutional capital, but this double-edged sword works in both directions. Because these funds hold underlying spot Bitcoin via regulated custodians without requiring investors to manage private keys, they make allocations exceptionally easy. Unfortunately, this also makes them uniquely vulnerable to rapid liquidations. If bond yields spike, equity markets correct, or regulatory crosswinds emerge, institutional capital can—and historically does—exit these vehicles with ruthless speed.
4. What Lies Ahead for the Rest of 2026?
As the market enters the final stretch of 2026, all eyes remain fixed on order books and daily flow trackers. The central question dominating trading desks is no longer whether the deficit can be erased—that mission has been accomplished. Instead, investors are intensely watching to see whether the recent six-day, $2.84 billion surge represents the foundation of a durable, late-year bull run or merely a temporary flash of enthusiasm driven by a localized price breakout.
For now, the green shoots are visible, the deficit is history, and the spot Bitcoin ETF story for 2026 has been rewritten from a cautionary tale of capital flight into a remarkable testament to market resilience.
