

The cryptocurrency market is currently witnessing a period of recalibration, and Solana (SOL) finds itself at the center of this volatile transition. After failing to maintain critical support levels above the $67 threshold, the asset has entered a corrective phase, mirroring the broader market stagnation seen in major digital assets like Bitcoin and Ethereum. As investors closely monitor price action, the immediate future of SOL hinges on its ability to stabilize above key psychological support zones.
Main Facts: The Current State of Solana
Solana, often hailed for its high-throughput blockchain capabilities and vibrant ecosystem, has recently faced significant downward pressure. The price momentum, which had shown signs of recovery earlier this week, hit a ceiling near $67.90 before experiencing a sharp rejection.
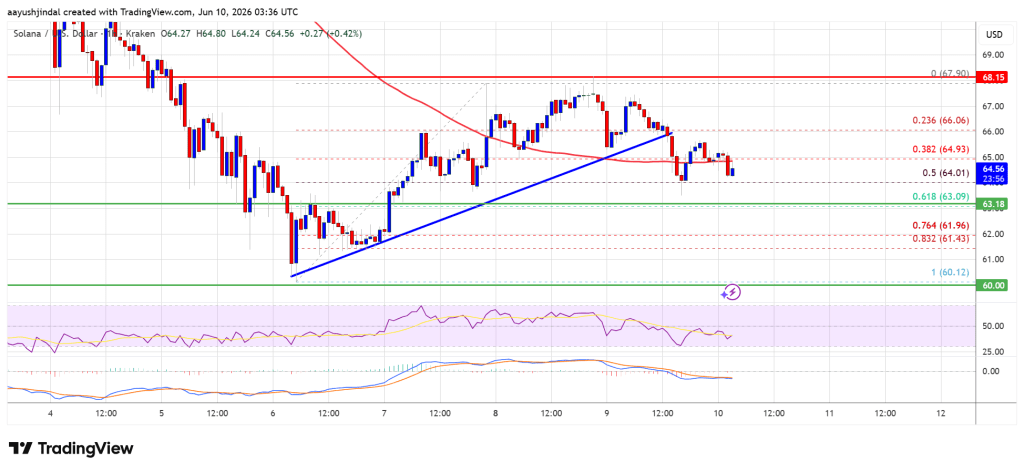
Currently, the asset is trading below the $65 mark, a critical level that previously served as a foundation for bullish attempts. Furthermore, the price has dipped below the 100-hourly simple moving average, a technical indicator that typically signals a shift in medium-term momentum toward the bears. With the hourly MACD losing pace in the bearish zone and the Relative Strength Index (RSI) hovering below the neutral 50 level, the technical outlook suggests that sellers currently hold the upper hand in the short term.
Chronology of the Decline
The recent price trajectory of Solana can be mapped through a sequence of technical failures and market reactions:

- The Failed Breakthrough: Solana reached a swing high of $67.90, attempting to consolidate above the $67 level. However, sustained buying pressure failed to materialize, leading to a quick reversal.
- Breach of Support: The momentum faltered, leading to a break below a significant bullish trend line that had been supporting the price at $66. This served as the primary catalyst for the subsequent sell-off.
- The Retracement: The asset plummeted through the 50% Fibonacci retracement level (calculated from the $60.12 low to the $67.90 high). This rapid descent saw the price test the $63.20 support level, confirming the shift toward a bearish short-term bias.
- Current Consolidation: As of today, Solana is struggling to reclaim the $65 resistance. The price action suggests a "wait-and-see" approach from retail traders, as the market awaits a clear signal from broader macroeconomic indicators.
Supporting Technical Data
For market participants and analysts, the technical landscape provides a roadmap for potential future movements. The following data points are critical for understanding the current market structure:
Key Resistance Levels
- $65.00: The immediate hurdle. A successful close above this level is required to neutralize the current bearish sentiment.
- $66.00: A secondary resistance point that previously acted as a base. Reclaiming this would signal a return to more stable territory.
- $67.20 – $68.00: The primary barrier. A breakout here is necessary to initiate a bullish trend reversal toward the $70 mark.
Critical Support Levels
- $63.10: The first line of defense. This zone aligns with the 61.8% Fibonacci retracement level, making it a pivotal area for bulls to defend.
- $62.20: A major support level. Failure to hold this level would likely trigger a wave of liquidation, pushing the price toward lower support.
- $60.00: The psychological "floor." If this level is breached, it could open the door for a deeper correction toward the $55 range.
Implications for the Broader Ecosystem
The current price action of Solana is not an isolated event but rather a reflection of the interconnected nature of the digital asset space. When major cryptocurrencies like Bitcoin and Ethereum struggle to maintain their footing, the liquidity available for altcoins like Solana often thins out, leading to amplified volatility.
Impact on Decentralized Finance (DeFi)
Solana’s ecosystem relies heavily on its DeFi protocols. A prolonged price correction can lead to increased collateral liquidations within lending platforms built on the Solana blockchain. Users with high loan-to-value (LTV) ratios are currently at heightened risk, which may cause a temporary reduction in Total Value Locked (TVL) as liquidity providers withdraw funds to hedge against further downside.
Investor Sentiment and Market Psychology
The shift from a "buy-the-dip" mentality to a more cautious "risk-off" approach is evident. For long-term holders, the current decline is often viewed as a period of accumulation; however, for short-term traders, the bearish technical indicators (MACD and RSI) serve as a warning to minimize exposure until a clear trend reversal is confirmed.

Expert Analysis: A Nuanced Perspective
As noted by market expert Aayush Jindal, navigating these volatile periods requires a disciplined approach to technical analysis. In volatile markets, relying on arbitrary price targets is insufficient. Instead, traders must focus on the confluence of support/resistance levels and real-time volume analysis.
Jindal emphasizes that the integration of software engineering principles—such as algorithmic validation and systematic risk management—can provide a significant edge. When the market is in a downtrend, the primary goal is capital preservation. Identifying key Fibonacci levels and monitoring the interaction between the price and the 100-hourly moving average are essential practices for those aiming to survive the current market noise.
Future Outlook: Potential Scenarios
Looking ahead, two primary scenarios emerge for the Solana price action:
The Bullish Recovery:
Should Solana manage to consolidate above $63.10 and break through the $65.00 resistance with significant volume, it could invalidate the current bearish structure. A successful retest of $67.20 would be the primary trigger for a potential rally back toward the $70 level and beyond. This scenario is contingent on a broader market recovery and a reduction in selling pressure across the major exchanges.
The Bearish Continuation:
If the $63.10 support fails to hold, the path of least resistance remains downward. A drop below $62.20 would likely confirm a continuation of the bearish trend. In this scenario, the focus shifts to the $60 support level. A breakdown below this psychological barrier would likely induce panic selling, potentially testing the $55 support zone.
Final Considerations for Investors
As the crypto market continues to evolve, the necessity for robust research cannot be overstated. Investors are encouraged to look beyond the immediate price action and consider the fundamental utility of the Solana network, its ongoing development, and the overall macroeconomic environment, including interest rate decisions and regulatory updates.
While technical indicators currently point toward a defensive stance, the history of the cryptocurrency market is filled with rapid reversals and unexpected volatility. Maintaining a balanced portfolio, setting stop-loss orders to mitigate downside risk, and staying informed through credible analytical sources remain the cornerstones of responsible investing.
Disclaimer: The information provided in this article is for educational purposes only and does not constitute financial advice. Investing in digital assets involves significant risk, and market conditions can change rapidly. Always conduct your own due diligence and consult with a professional financial advisor before making any investment decisions.
