

The cryptocurrency market is currently witnessing a period of intense scrutiny, with Ripple’s XRP token finding itself at a critical technical juncture. Following a failed attempt to maintain momentum above the $1.150 threshold, the asset has entered a corrective phase, mirroring broader market weakness seen in major assets like Bitcoin and Ethereum. As of the latest market data, XRP is grappling with significant bearish pressure, forcing traders and analysts to reassess their short-term outlooks as the token tests key psychological support levels.
The Chronology of the Current Downturn
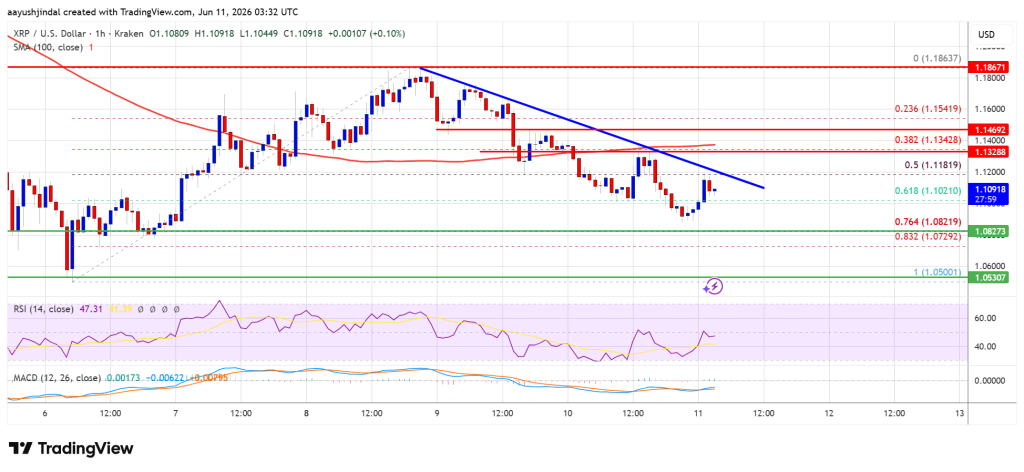
The recent price action for XRP has been defined by a rapid shift in market sentiment. After an impressive rally that saw the token flirt with the $1.1862 high—a significant swing point for recent weeks—the asset struggled to establish a firm base above the $1.1550 resistance level.
The Initial Breakdown
The decline began in earnest as sell orders began to outweigh buying interest near the $1.150 mark. This initial drop acted as a catalyst, triggering a cascade of stop-loss orders that pushed the price below the $1.1420 support level. The speed of the move was notable, as the asset broke through the 50% Fibonacci retracement level of the rally originating from the $1.050 swing low.
The Current Technical Stagnation
Currently, the market is caught in a tight range. XRP is trading below both the $1.1350 resistance and the 100-hourly Simple Moving Average (SMA), which serves as a definitive indicator of short-term bearish dominance. Bulls have attempted to defend the $1.100 support zone, but their efforts are being hampered by a persistent bearish trend line that has established resistance at the $1.120 level on the hourly chart. This ceiling prevents the asset from reclaiming lost ground, keeping the broader trend firmly tilted toward the downside.
Supporting Technical Data and Indicators
To understand the mechanics behind this price movement, one must look at the quantitative data driving the market behavior. Technical analysis provides a roadmap of the current state of the XRP/USD pair.

MACD and RSI Analysis
The Hourly Moving Average Convergence Divergence (MACD) indicator for the XRP/USD pair is currently losing momentum within the bearish zone. This suggests that the selling pressure, while present, is currently in a consolidation phase rather than an outright capitulation. Simultaneously, the Relative Strength Index (RSI) is hovering below the 50 neutral level. This placement is a clear signal that the bears maintain control over the price action, with no immediate signs of an oversold condition that would typically trigger a reflexive bounce.
Fibonacci Retracement Levels
The Fibonacci retracement tool remains the most accurate gauge for the current price structure. The $1.080 level represents the 76.4% retracement level of the move from $1.050 to $1.1862. This zone is arguably the most critical defensive line for the bulls. Should the price fall and close below this level, it would technically invalidate the previous bullish thesis and likely open the door for a retest of the $1.050 floor.
Potential Scenarios and Key Price Hurdles
Market participants are now weighing two distinct paths: a recovery attempt or a deeper decline.
The Path to Recovery
For the bulls to reclaim control, XRP must first break through the immediate resistance at $1.120. A successful breach of this trend line is not enough on its own; the asset would then need to overcome the $1.1350 hurdle to invalidate the current bearish sentiment. Only a decisive move above $1.1420 would provide the necessary volume to challenge the $1.1550 and $1.1650 resistance zones. A successful break above $1.1840 would be required to shift the macro trend back to bullish.
The Risk of Further Decline
If the $1.100 support is breached, the situation becomes increasingly precarious. A move below $1.080 would likely accelerate the descent toward $1.0650. The ultimate test for the long-term trend remains the $1.050 support zone. Should this break, the market could see a rapid move toward $1.020, with the psychologically significant $1.00 level serving as the final line of defense for market participants.

Market Implications and Broader Context
The performance of XRP cannot be viewed in a vacuum. It is heavily influenced by the prevailing winds of the cryptocurrency market, which is currently undergoing a systemic shift in risk appetite.
Correlated Assets and Market Sentiment
The parallel decline of XRP with Bitcoin and Ethereum suggests that this is a market-wide phenomenon. When market leaders face pressure, altcoins often experience heightened volatility. Traders are currently monitoring macroeconomic reports and regulatory developments that affect the entire crypto space, which exacerbates the sensitivity of individual assets like XRP.
The Role of Institutional Interest
XRP’s price action is also deeply tied to its utility and the ongoing development of its underlying network. While short-term technicals are currently in the red, long-term investors are often less concerned with hourly fluctuations and more focused on the fundamental adoption of the Ripple network. However, until there is a shift in the broader technical structure, institutional accumulation may remain cautious, waiting for a clearer signal that the price has bottomed out.
Expert Perspective on Volatility
In the world of high-frequency trading and technical analysis, volatility is not merely a risk—it is a landscape to be navigated. According to senior market analysts, the current phase is characterized by a "wait and see" approach from institutional players. The intersection of technical indicators, such as the 100-hour SMA and the current RSI levels, suggests that the market is in a period of price discovery.
The primary lesson for traders at this juncture is the importance of risk management. In volatile environments, the tendency to "catch a falling knife" often leads to significant capital erosion. Instead, the focus should remain on observing the interaction between the price and key support/resistance levels. If the price fails to hold the $1.100 support, the prudent action for many has been to tighten stop-loss orders or wait for a confirmed reversal pattern on higher timeframes.
Conclusion: What Lies Ahead?
The road ahead for XRP is fraught with both challenges and potential opportunities. While the current technical indicators suggest a bearish bias, the resilience shown by the bulls at the $1.100 level cannot be ignored. The market is waiting for a catalyst—either a significant influx of buying volume that could breach the $1.1350 resistance, or a definitive breakdown that would test the resolve of long-term holders at the $1.00 level.
As the cryptocurrency market continues to mature, the price of XRP will likely remain a bellwether for investor sentiment regarding cross-border payment solutions and decentralized finance. Investors are advised to remain vigilant, keep a close watch on the MACD and RSI indicators, and—most importantly—conduct thorough research before making any decisions in this high-stakes environment.
Disclaimer: The information provided in this analysis is for educational purposes only and does not constitute financial, investment, or trading advice. Cryptocurrency investments are subject to high volatility and market risk. You are strongly advised to conduct your own due diligence and consult with a certified financial advisor before making any investment decisions. The views and opinions expressed here are those of the analysis team and do not necessarily reflect the official policy or position of any organization. Use the information provided on this platform at your own risk.
