

The cryptocurrency market is currently navigating a period of significant volatility, with XRP—the native token of the Ripple network—finding itself under intense selling pressure. After failing to maintain its foothold above the critical $1.150 support level, XRP has entered a phase of corrective decline. As global market sentiment cools and major assets like Bitcoin and Ethereum struggle to reclaim recent highs, traders are closely monitoring whether XRP can find a bottom or if it is destined for further retracement toward psychological support levels.
The Anatomy of the Current Downturn
The recent price action in the XRP market has been characterized by a distinct shift from bullish momentum to a defensive posture. XRP, which had previously shown resilience, struggled to sustain its momentum above the $1.1550 threshold. This inability to hold key levels triggered a series of sell orders, causing the asset to dip below both the $1.150 and $1.1420 support zones.
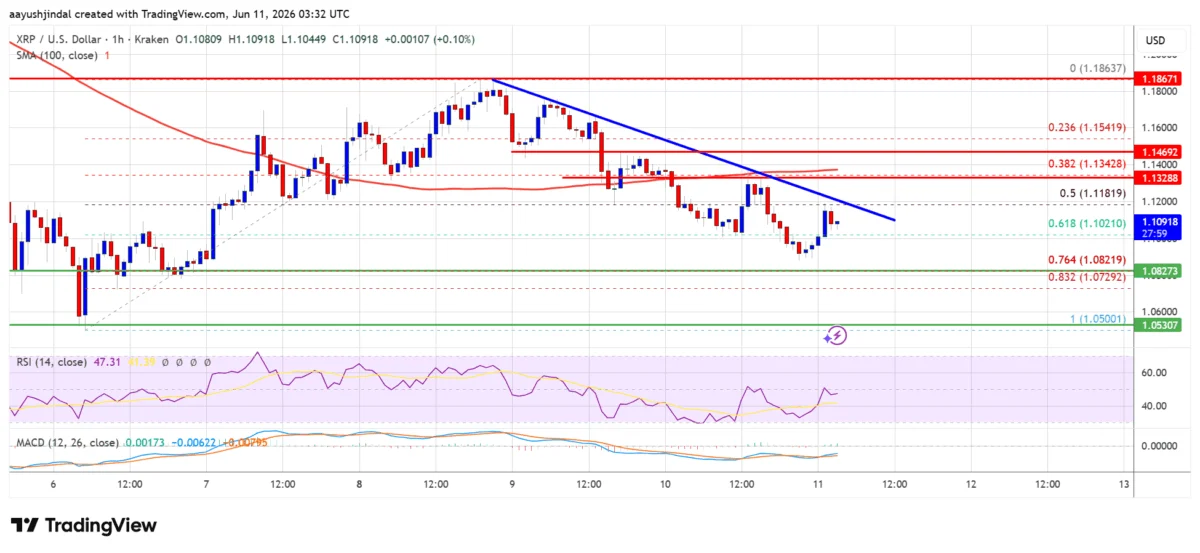
This decline is not occurring in a vacuum. As part of a broader cooling trend in the digital asset space, XRP’s performance mirrors the vulnerability currently being exhibited by top-tier cryptocurrencies. The technical structure of the XRP/USD pair has shifted; the price has fallen below the 50% Fibonacci retracement level of the upward move that spanned from the $1.050 swing low to the $1.1862 high. Currently, the asset is trading below its 100-hour Simple Moving Average (SMA), a bearish indicator that suggests sellers remain in control of the short-term trend.
Chronology of the Decline: From Momentum to Correction
To understand the current state of XRP, it is essential to trace the recent price trajectory.
- The Peak and Stall: During the recent rally, XRP reached a local high of $1.1862. This served as a ceiling, where selling pressure began to outpace buying demand.
- Initial Breach: The first sign of trouble appeared when the asset failed to consolidate above the $1.1550 level. Traders noted an increase in volume on the sell side as the price slipped below the $1.150 mark.
- The Current Consolidation: As of today, the market is attempting to establish a defensive line near $1.10. A bearish trend line has emerged on the hourly chart, acting as a dynamic resistance point near $1.120. Every attempt to rally toward this trend line has been met with fresh supply, confirming the bearish sentiment currently permeating the order books.
Technical Data and Market Indicators
Technical analysis provides a roadmap for where the asset might head next. According to current charts, the indicators are painting a cautious picture for investors.

The MACD and RSI Signals
The Hourly Moving Average Convergence Divergence (MACD) is currently losing momentum in the bearish zone. A contracting histogram suggests that while the downward trend is active, the intensity of the selling may be stabilizing temporarily. However, the lack of a bullish crossover indicates that a reversal is not yet on the horizon.
Simultaneously, the Hourly Relative Strength Index (RSI) is hovering below the 50 level. In technical terms, this confirms that the market is in a "bearish territory," where momentum favors the sellers. For a recovery to be sustained, the RSI would need to reclaim the 50 level and push toward the 60 range, which would signal a shift in market sentiment.
Support and Resistance Levels
Investors are currently watching two key zones:
- Immediate Resistance: The $1.120 and $1.1350 levels act as the primary hurdles for the bulls. A breakout above $1.1350 would be necessary to invalidate the current bearish structure and potentially test the $1.1420 and $1.1550 resistance levels.
- Critical Support: On the downside, the $1.10 level is the first line of defense. If this fails, the next major target is the $1.080 zone—which aligns with the 76.4% Fibonacci retracement level of the previous upward swing. A close below $1.080 would open the door for a deeper correction toward $1.0650 and potentially the $1.050 support zone.
Implications for Investors and the Broader Market
The current price action of XRP has significant implications for both retail traders and institutional holders. For the retail community, the dip below the 100-hour SMA serves as a warning to manage risk, as the market is clearly in a phase of re-evaluating its valuation after the recent rally.
For the broader market, XRP remains a bellwether for altcoin sentiment. Because of its large market capitalization and high liquidity, its price movements often influence the broader sentiment for mid-cap assets. A prolonged decline below $1.00 could signal a deeper, market-wide correction, whereas a strong bounce from the $1.080 support could serve as a catalyst for a recovery across the decentralized finance (DeFi) sector.

Furthermore, investors must consider the external environment. Cryptocurrency markets are currently highly sensitive to macroeconomic shifts, including interest rate projections and regulatory news cycles. While the technical indicators are currently bearish, unexpected developments in the ongoing legal or regulatory frameworks surrounding the digital asset industry often cause sudden, high-volume price movements that can bypass technical setups.
Expert Perspective: Navigating Volatility
Financial experts suggest that in times of technical uncertainty, the most prudent approach is to focus on risk management. When an asset like XRP falls below its moving averages, the probability of further downside increases. Investors are advised to watch the $1.10 level with a high degree of scrutiny; a breakdown here is likely to trigger stop-loss orders, potentially accelerating the decline toward the $1.050 support level.
However, it is equally important to note that markets rarely move in straight lines. The current structure is not necessarily indicative of a long-term bear market, but rather a necessary correction. In the history of XRP, sharp retracements have often preceded periods of intense consolidation and subsequent growth. Traders looking for entry points may wait for a "re-test" of the $1.1350 level—if the price can break and hold above this, it could indicate a failed breakdown and a potential reversal of the current trend.
Conclusion: The Path Ahead
XRP currently sits at a technical crossroads. The path of least resistance remains to the downside as long as the price trades below the $1.1350 resistance and the 100-hour SMA. For the bulls to regain control, they must demonstrate sufficient volume to clear the $1.120 trend line resistance and reclaim the $1.1550 level.
Until then, market participants should remain vigilant. The combination of declining RSI, bearish MACD, and the breach of key support levels suggests that the market is in a "wait-and-see" mode. Whether XRP finds stability at the $1.080 support or continues its slide toward the $1.00 psychological threshold will depend on the market’s ability to absorb the current selling pressure.
In the volatile world of cryptocurrency, today’s support is tomorrow’s resistance. As we observe the next few trading sessions, the focus will remain on the $1.10 level, as it represents the final barrier before a more significant retracement. Investors are encouraged to exercise caution, maintain rigorous stop-loss protocols, and stay informed on the shifting dynamics of the global digital asset markets.
Disclaimer: The analysis provided in this article is for educational purposes only and does not constitute financial advice. Cryptocurrency investments are inherently risky, and market conditions can change rapidly. All readers are advised to conduct their own independent research and consult with a professional financial advisor before making any investment decisions. The author and the publication assume no responsibility for any financial losses incurred based on the information provided herein.
