


October 8, 2026
By Market Desk
Main Facts
In the colloquial lexicon of crypto traders, October has long held a mythical status. Widely celebrated as "Uptober," the tenth month of the calendar year is historically expected to deliver some of Bitcoin’s most substantial percentage gains, often setting the stage for exuberant fourth-quarter rallies. Yet, for the second consecutive year, the cryptocurrency market is actively flipping the script, delivering an unseasonal cold snap instead of autumnal warmth.

Bitcoin is sliding once again, registering a 2.67% drop over a 24-hour window to trade near $81,125. This downward pressure has effectively erased nearly half of the flagship digital asset’s gains accumulated throughout September—a month that itself defied historical curses by posting positive momentum, only to hand the baton to a lackluster October.
The immediate catalyst for this price contraction is not isolated to the digital asset ecosystem. Bitcoin is currently wrestling with a hostile macroeconomic landscape. Wall Street retreated from record highs as Brent crude oil hovered stubbornly near $100 a barrel, threatening renewed energy shocks. Concurrently, U.S. Treasury yields have held firm near levels not seen since 2002. Adding to the pressure, the minutes from the most recent Federal Reserve meeting revealed that a majority of central bank officials anticipate yet another interest rate hike before the year concludes, signaling that "higher-for-longer" monetary policy is far from a ghost of the past.
These combined headwinds have triggered a wave of derivative market stress. Over the past 24 hours, approximately $429 million in leveraged positions were liquidated across the broader crypto market, with an overwhelming 87.5% of those liquidations coming from long positions. While technical indicators on the daily chart continue to flash resilience, the shorter timeframes suggest that market bulls are losing their cushion.
Chronology
To understand how the market arrived at its current precarious footing, it is helpful to trace the timeline of Bitcoin’s movements leading up to this October correction:
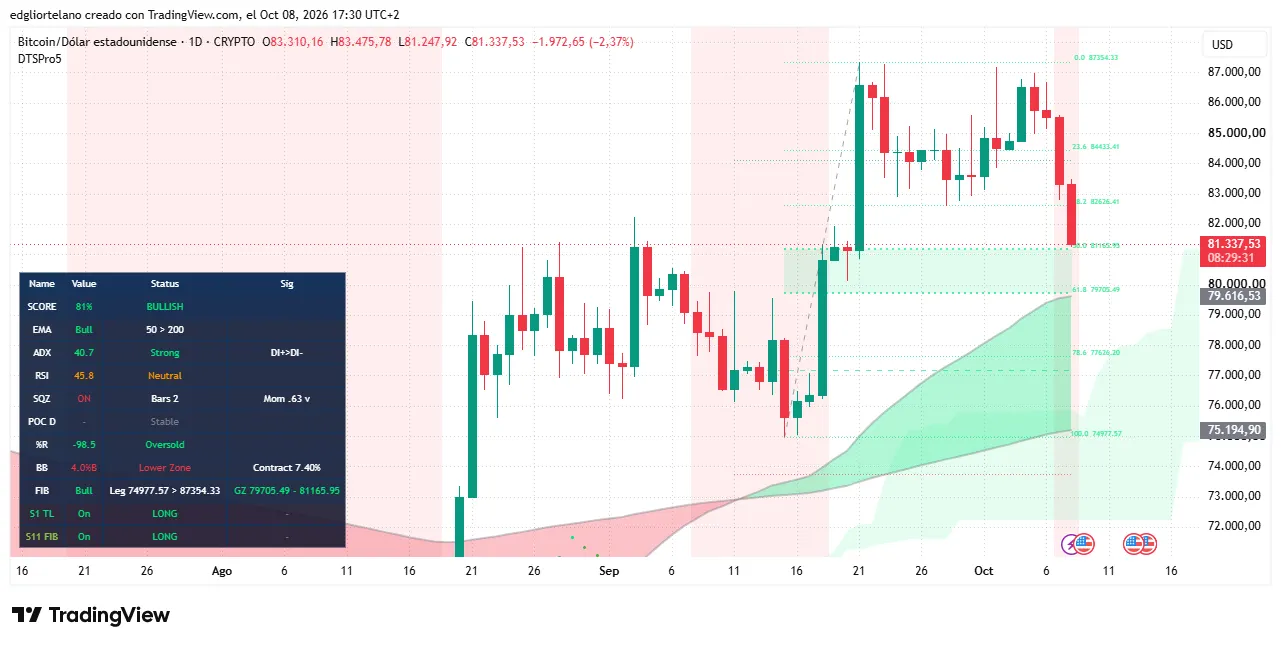
- September 21, 2026: Bitcoin hits a local peak of $87,354.33, capping off an unexpectedly strong month of accumulation that briefly sidelined historical narratives about a "Red September."
- Late September to Early October: Following its late-September high, BTC enters a prolonged consolidation phase, moving sideways in a tight range between roughly $83,000 and $87,000 for more than two weeks.
- October 6–7, 2026: Macroeconomic fears boil over. Wall Street pulls back from record highs as Brent crude surges toward $100 a barrel and Treasury yields remain elevated. Federal Reserve meeting minutes signal a potential further rate hike before year-end.
- October 7, 2026: Spot Bitcoin Exchange-Traded Funds (ETFs) endure their worst single-day outflow since June, bleeding $484.9 million in a single session. This massive redemption wipes out roughly 81% of the $595.3 million that had flowed into the funds over the preceding nine trading days.
- October 8, 2026 (Today): Bitcoin opens its daily candle at $83,310.16, struggles to gain upward traction past $83,475.78, and drops sharply to intraday lows of approximately $81,337. The asset trades down 2.37% on the day, breaching key short-term supports and putting severe pressure on leveraged long traders.
Supporting Data
A deep dive into technical indicators, ETF flows, and liquidation metrics reveals a market caught in a tug-of-war between a fragile long-term uptrend and deteriorating short-term momentum.
Technical Analysis and Price Levels
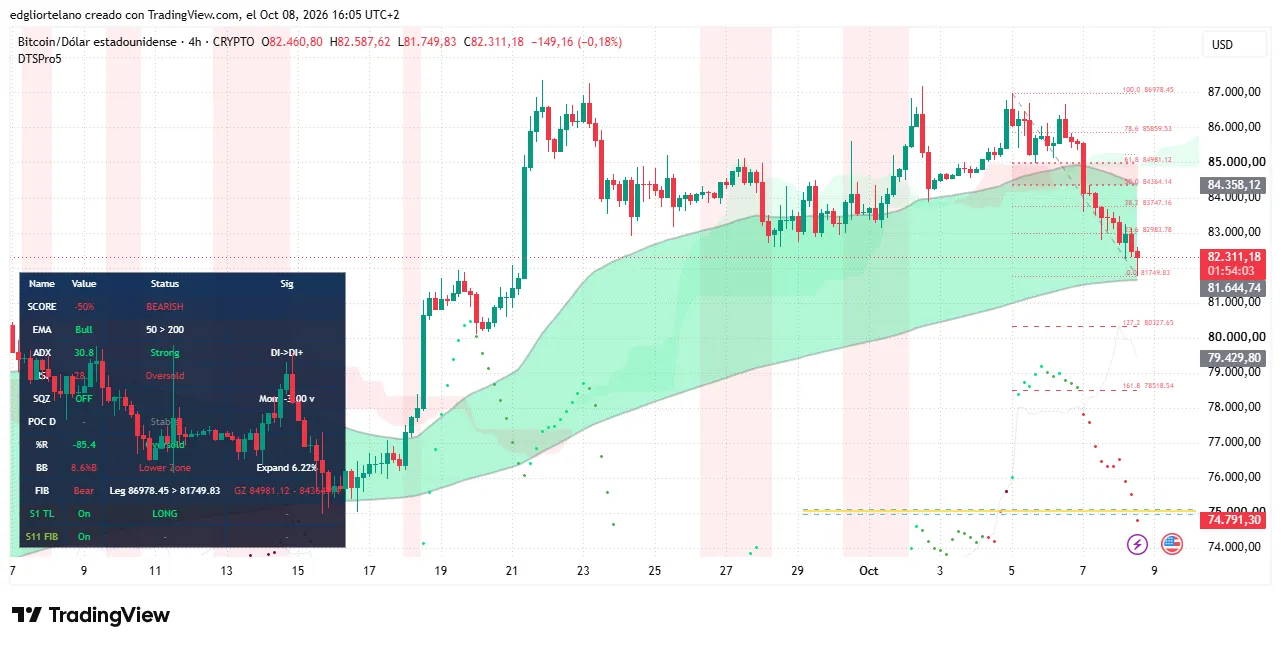
- Moving Averages: The 50-day Exponential Moving Average (EMA) remains safely above the 200-day EMA on the daily chart, meaning the classic "golden cross" pattern that signifies a long-term bullish trend is technically still intact. However, on intraday timeframes, this gap is rapidly closing as Bitcoin drifts closer to the 200 EMA line.
- Trend Strength (ADX): The Average Directional Index (ADX) on the daily chart sits at 40.7—down slightly from 42.8 yesterday. While readings above 25 generally confirm a persistent trend, and buying pressure (+DI) remains ahead of selling pressure (-DI), the cooling ADX points to a gradual loss of conviction among buyers.
- Momentum (RSI): The Relative Strength Index (RSI) has slipped to 45.8, down from 52.5. This drop pushes the momentum indicator below the crucial neutral 50-line, signaling that short-term momentum has tilted in favor of the bears. Meanwhile, the Squeeze Momentum Indicator remains active, warning that market volatility is compressed like a coiled spring, awaiting a definitive breakout or breakdown.
- Critical Support Zones: Bitcoin’s daily candle undercut the $82,776.30 floor established earlier in the week, sliding below the short-term price zone of $82,626.41. Below current levels lies a pivotal "golden zone" between $81,165.95 and $79,705.49—a historical historical retracement pocket where pullbacks within larger bull trends frequently attract institutional and retail buyers.
ETF Flows and Derivatives
- Institutional Redemptions: According to market flow data, spot Bitcoin ETFs suffered a severe setback on October 7, shedding $484.9 million. This single-day outflow slashed the 10-day net inflow total down to $110.4 million. Despite the jarring exit, cumulative net inflows since the inception of these products remain robust at $57.8 billion, characterizing the drop as a notable dent rather than a systemic institutional exodus.
- Liquidation Cascade: CoinGlass data highlights that approximately $429 million in positions were forcibly closed over a 24-hour period. Bitcoin accounted for $135.51 million of these liquidations, while Ethereum contributed $96.14 million. Significantly, nearly half of the total liquidations ($202.24 million) occurred within a compressed four-hour window, underscoring how forced selling by over-leveraged long traders accelerates downward price spikes.
Official Responses and Stakeholder Perspectives
While the Federal Reserve does not comment directly on daily cryptocurrency price fluctuations, the central bank’s official communications have profoundly shaped market sentiment. The release of the latest Federal Reserve meeting minutes made it clear that policymakers remain vigilant regarding persistent inflation and robust economic data. The prevailing consensus among Fed officials that another rate hike remains on the table before the year closes has directly impacted risk-on assets, forcing traders to reprice their risk models.
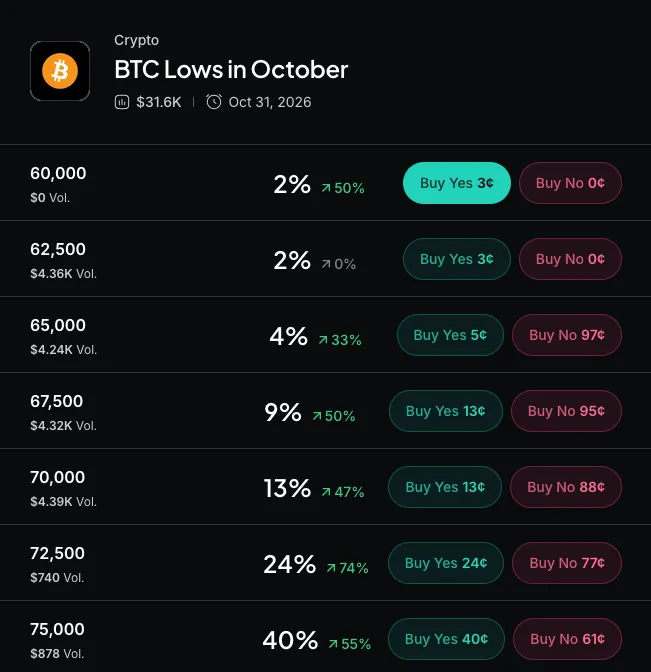
At the same time, market analysts and prediction market participants are actively re-evaluating the "Uptober" narrative. Platforms like Myriad have seen a surge in participation as traders cast predictions on how low Bitcoin might correct before finding a definitive floor. Institutional desk managers note that while the macroeconomic headwinds—spanning energy shocks in the Middle East, shipping anxieties around the Strait of Hormuz, and domestic bond market yields—are undeniable, the underlying structural demand via spot ETFs prevents the type of catastrophic capitulation witnessed in previous crypto winters.
Implications
The divergence between historical seasonality and current market reality carries several critical implications for investors, traders, and the broader financial ecosystem:
- The Death of Calendar Determinism: The failure of "Uptober" to materialize as expected for the second year in a row reinforces the lesson that historical seasonality is a weak trading strategy in a maturing asset class. Bitcoin is increasingly behaving less like an isolated digital novelty and more like a high-beta risk asset inextricably linked to global macro liquidity.
- Macro Dominance Over Crypto Narratives: When Brent crude flirts with $100 a barrel and the Federal Reserve contemplates additional monetary tightening, crypto-native narratives take a back seat. Bitcoin’s correlation with broader macroeconomic indicators—such as Treasury yields, inflation prints, and equity market corrections—demonstrates that external financial conditions dictate the near-term ceiling and floor of digital asset prices.
- The Risk of Over-Leverage: The swift liquidation of nearly half a billion dollars in leveraged positions highlights the ongoing vulnerability of the crypto derivatives market. Excessive leverage continues to amplify routine market corrections into sharp, cascading flash crashes, punishing retail and institutional accounts alike.
- Key Levels to Watch: In the immediate term, market participants are laser-focused on whether Bitcoin can defend the $79,700–$81,100 golden support zone. A daily close below $82,626.41 confirms a deeper short-term correction, whereas a recovery above this threshold could allow BTC to resume its multi-week sideways consolidation range. All eyes now turn to upcoming inflation prints, oil price stabilization, and the Federal Reserve’s scheduled meetings later in the month.
