

Executive Summary: XRP Under Pressure
XRP, the native digital asset of the Ripple ecosystem, is currently navigating a period of significant technical turbulence. After failing to sustain bullish momentum above the $1.150 price threshold, the asset has entered a corrective phase, mirroring a broader market downturn observed across major cryptocurrencies, including Bitcoin and Ethereum. As of the latest market data, XRP is exhibiting clear bearish signals, raising concerns among investors regarding the potential for further downside testing of support levels near the $1.080 and $1.050 marks.
This report provides an in-depth analysis of the current market structure, the technical indicators driving this movement, and the potential implications for traders as the asset struggles to reclaim critical resistance levels.
The Chronology of the Downturn
The recent price action for XRP has been defined by a rapid shift in sentiment. Over the past several trading sessions, the asset attempted to establish a firm foundation above the $1.1550 level. However, a lack of sustained buying volume allowed sellers to regain control, triggering a cascade of sell orders.
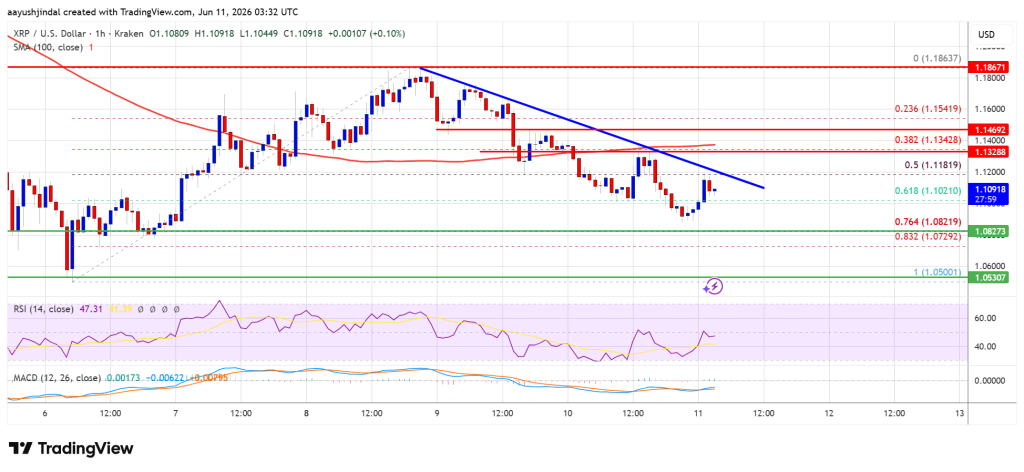
- The Breakdown: XRP broke through the critical $1.150 and $1.1420 support levels, signaling a loss of short-term bullish control.
- The Retracement: The asset slid below the 50% Fibonacci retracement level of the upward move that spanned from the $1.050 swing low to the $1.1862 high.
- Current Consolidation: Bulls are currently fighting to maintain the $1.10 support zone. Simultaneously, a descending trend line has formed on the hourly charts, creating immediate selling pressure at the $1.120 level.
The inability of the asset to clear the $1.1350 barrier—now acting as a significant resistance point—has left the market in a state of flux, with traders closely monitoring the 100-hourly Simple Moving Average (SMA) for signs of a directional shift.

Technical Data and Market Metrics
A professional evaluation of the XRP/USD pair reveals several concerning metrics that suggest the bearish trend may have further room to run before finding a stable floor.
The Fibonacci Perspective
The current price action is hovering near a technical crossroads. By analyzing the swing from the $1.050 low to the $1.1862 peak, we can identify that the asset is testing the 76.4% Fibonacci retracement level near $1.080. If this level fails to hold, historical data suggests a high probability of a deeper slide toward the $1.050 or even the psychological $1.000 support level.
Momentum Indicators
- MACD (Moving Average Convergence Divergence): The hourly MACD for XRP/USD is currently losing momentum within the bearish zone. This indicates that sellers still possess the volume advantage, and the lack of a bullish crossover suggests that buying interest remains thin.
- Relative Strength Index (RSI): The RSI is currently situated below the 50-neutral mark. In technical analysis, an RSI below 50 in a downtrend indicates that the selling pressure is currently outpacing the buying pressure, reinforcing the bearish outlook.
Strategic Resistance and Support Levels
For traders and institutional participants, identifying key "pivot points" is essential for risk management in the current climate.
Key Resistance Levels
- $1.1200: This represents the immediate hurdle and the point where the descending trend line meets the current price action. A breakout here is required to invalidate the current short-term bearish thesis.
- $1.1350: The secondary hurdle. This level coincides with the 100-hourly SMA. Clearing this would be the first major step toward recovery.
- $1.1420: A crucial pivot; reclaiming this level would likely shift the market bias back to neutral or bullish.
Key Support Levels
- $1.1000: The primary psychological support. A clean break below this would likely trigger stop-loss orders from retail traders.
- $1.0800: A high-confluence support level based on Fibonacci retracement analysis.
- $1.0500: The final major support level before the asset risks testing the $1.000 milestone.
Implications of the Current Market Structure
The implications of the current price correction extend beyond simple chart patterns. XRP has long been a bellwether for market sentiment regarding regulatory clarity and institutional adoption. When the asset fails to hold its ground during broader market corrections, it often reflects a decrease in speculative liquidity.

Institutional vs. Retail Sentiment
While retail traders often react impulsively to these price dips, institutional players are likely monitoring the $1.000 to $1.050 range as an accumulation zone. If the asset manages to find support above $1.050, it could set the stage for a period of range-bound trading, allowing for a "basing" process before any potential attempt at a rally. However, a failure to hold these levels could lead to a capitulation event, shaking out weak hands and potentially leading to a sharp, albeit short-lived, drop in price.
The Role of Market Correlation
It is imperative to note that XRP is not moving in a vacuum. As noted in recent observations, its performance is closely tethered to the movements of Bitcoin and Ethereum. If the broader crypto market continues to face "red" days, it is highly unlikely that XRP will decouple from the trend. Investors should prioritize monitoring the "total market cap" of the cryptocurrency sector as a leading indicator for XRP’s future performance.
Conclusion: The Path Forward
The current state of the XRP market is one of caution. The technical indicators are pointing toward a continued, albeit controlled, decline unless there is a significant influx of buy-side volume to challenge the existing resistance levels.
Investors are advised to:
- Monitor the $1.10 support: This is the line in the sand for short-term holders.
- Watch the $1.12–$1.135 resistance zone: A failure to break this on a volume-supported move confirms the bearish continuation.
- Exercise Risk Management: Given the volatility, stop-loss orders and position sizing are critical tools for navigating this period of uncertainty.
As the market continues to evolve, the focus remains on whether the bulls can regain the momentum necessary to break the current bearish trend line. Until then, the market remains in a defensive posture, awaiting a clear signal from the broader economic landscape to dictate the next leg of the journey.
Disclaimer: The analysis provided in this report is for educational and informational purposes only. It does not constitute financial, investment, or trading advice. Cryptocurrencies are highly volatile assets; investing in them carries significant risks, including the potential loss of capital. Always conduct your own due diligence and consult with a certified financial advisor before making any investment decisions. Use the information provided herein entirely at your own risk.
