


The cryptocurrency market is currently witnessing a period of intense scrutiny, with Ripple’s XRP finding itself under significant downward pressure. After failing to sustain momentum above the critical $1.150 resistance zone, the asset has entered a corrective phase, mirroring the broader market instability currently affecting major digital assets like Bitcoin and Ethereum. As of the latest trading sessions, XRP’s technical posture suggests that bearish sentiment is intensifying, forcing investors to closely monitor key support levels to determine the next major trend.
The Current Market Landscape: A Shift in Momentum
The recent price action for XRP has been characterized by a sharp rejection from the $1.1550 level. This failure to hold higher ground has triggered a cascading effect, pushing the token below the pivotal $1.150 and $1.1420 support thresholds. This descent is not an isolated incident; rather, it reflects a broader macro-trend where high-cap assets are grappling with profit-taking and reduced liquidity in the short term.
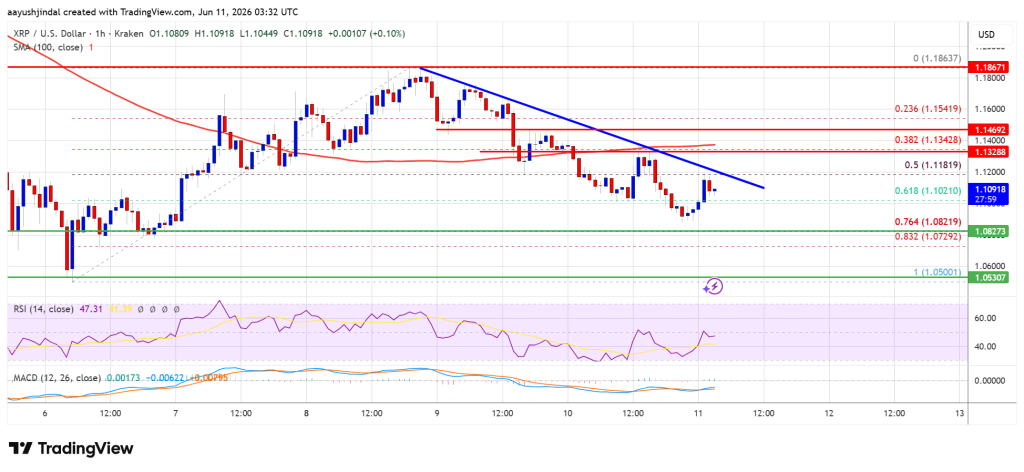
The current price structure suggests a classic "bearish correction." Having dipped below the 50% Fibonacci retracement level of the rally spanning from the $1.050 swing low to the $1.1862 high, the market is currently testing the resilience of the bulls. While the $1.10 support zone is providing a temporary floor, the presence of a bearish trend line on the hourly charts—clashed with resistance at $1.120—indicates that sellers are firmly in control of the near-term narrative.
Chronology of the Recent Decline
To understand the current volatility, one must look at the progression of the last few trading days:

- The Peak Attempt: Earlier this week, XRP attempted to consolidate above the $1.1550 mark, showing promise for a breakout toward higher resistance levels.
- The Breakdown: Following a failure to breach the $1.1862 high, selling volume spiked. This led to a rapid liquidation of long positions, driving the price through the $1.150 support barrier.
- The Retest: Attempted rallies over the last 24 hours have been consistently capped at the $1.120 to $1.1350 range. Every time the price has approached these levels, it has been met with significant overhead supply, forcing a retreat back toward the $1.10 handle.
- Current State: The asset is now hovering in a "no-man’s land" below the 100-hourly Simple Moving Average (SMA), which serves as a psychological indicator that the short-term trend has officially flipped from bullish to bearish.
Technical Analysis: Beneath the Surface
For traders and institutional analysts, the technical indicators provide a sobering outlook on the immediate future of XRP.
Key Moving Averages and RSI
The hourly MACD (Moving Average Convergence Divergence) is currently losing pace within the bearish zone. This suggests that the downward momentum, while perhaps not accelerating, is persistent. Simultaneously, the Relative Strength Index (RSI) for the XRP/USD pair has dipped below the 50-level, a standard signal that momentum is currently favoring the bears rather than the bulls.
Fibonacci Levels as Roadmaps
The 76.4% Fibonacci retracement level, drawn from the move between $1.050 and $1.1862, sits near the $1.080 mark. Market participants are watching this level with extreme caution. A decisive break below this point would likely invalidate the bullish thesis established in recent weeks and could invite a deeper sell-off.
Resistance Hurdles
For a bullish reversal to occur, the price must first reclaim the $1.120 resistance level. Following this, the $1.1350 mark acts as the primary barrier. Only a sustained breakout above $1.1420 would signify that the bearish pressure has subsided, potentially opening the doors to a retest of the $1.1550 and $1.1650 resistance zones.

Implications for Investors and the Broader Market
The implications of this correction are significant for the XRP ecosystem. Firstly, it highlights the asset’s sensitivity to the broader crypto market’s health. When Bitcoin faces selling pressure, altcoins—even those with high utility like XRP—often suffer exacerbated drawdowns.
Secondly, the current price action serves as a stress test for long-term holders. If the price manages to consolidate around the $1.050 to $1.080 support region, it may create a "higher low" structure that could form the base for a more sustainable, long-term rally. However, should the price break below the $1.00 psychological threshold, it could trigger a "capitulation" phase, where forced liquidations lead to further, rapid volatility.
Strategic Outlook: What Lies Ahead?
Investors should be prepared for two potential scenarios as the week progresses:
- The Bearish Continuation: If the price fails to overcome the $1.1350 resistance, we can expect a retest of the $1.080 support. A failure here likely leads to a slide toward the $1.050 zone, with the possibility of testing the major $1.00 support level. This scenario is increasingly likely if the broader market (BTC/ETH) continues to trade in the red.
- The Bullish Recovery: Should the market find a catalyst—perhaps a shift in sentiment or a positive news cycle—a push above $1.1420 would invalidate the current bearish pattern. This would likely bring in renewed buying interest, targeting the $1.1840 major hurdle.
Expert Insight: Navigating Volatility
Market participants are advised to maintain strict risk management protocols. As seen in previous cycles, XRP is known for its "sawtooth" price action, where sharp drops are often followed by equally sharp recoveries. However, relying on historical patterns alone is dangerous in a market influenced by macroeconomic factors, regulatory updates, and derivative positioning.
Traders should focus on the following levels for the coming session:
- Immediate Support: $1.1000, $1.0800.
- Major Support: $1.0500, $1.0200.
- Immediate Resistance: $1.1200, $1.1350.
- Major Resistance: $1.1420, $1.1840.
Conclusion
The XRP price is currently navigating a precarious path. While the bears currently dictate the hourly trends, the underlying fundamentals of the XRP Ledger and its growing integration into cross-border payment rails remain a point of interest for long-term investors. However, in the immediate term, the chart signals a clear warning. The inability to reclaim moving averages and the persistent failure at resistance levels suggest that until the market can clear the $1.1420 barrier, caution remains the most prudent approach.
As always, in the volatile world of cryptocurrency, the market dictates the rules. Investors should conduct their own due diligence, monitor the RSI and MACD signals closely, and avoid over-leveraging in an environment where the next move is heavily dependent on maintaining these critical support levels.
Disclaimer: The information provided in this report is for educational and informational purposes only. It does not constitute financial advice, investment advice, or a recommendation to buy or sell any digital assets. Investing in cryptocurrencies carries a high level of risk and may not be suitable for all investors. Always perform your own research and consult with a qualified financial advisor before making any investment decisions.
