
Bitcoin’s recent price action has provided a much-needed lifeline for market bulls, yet the prevailing sentiment among seasoned traders remains one of cautious skepticism. Rather than signaling a return to the unfettered euphoria that defined previous market peaks, the current movement is characterized by a "level-by-level" tactical approach. As Bitcoin attempts to stabilize, the focus has shifted toward granular analysis—specifically leveraging liquidation mapping to identify the next probable trajectory for the world’s leading cryptocurrency.
The State of the Market: A Tactical Recovery
The digital asset market is currently navigating a period of intense structural testing. Following a period of volatility that saw sentiment shift rapidly toward the bearish camp, Bitcoin has managed to reclaim key technical levels, offering a glimmer of hope to those positioned long. However, this is not a broad-based rally driven by blind optimism; it is a surgical move driven by liquidity hunting and the mechanics of the futures market.
Market participants are currently treating Bitcoin’s price floor as a delicate equilibrium. The prevailing view is that until the asset can definitively clear established overhead resistance, any upward momentum should be viewed through the lens of a "relief bounce" that requires validation rather than a confirmed trend reversal.
Chronology of the Current Rebound
To understand the current setup, one must look at the recent sequence of events that brought Bitcoin back into its current trading range:
- The Breakdown and Skepticism: In the sessions preceding the current recovery, Bitcoin faced significant downward pressure, leading many market participants to conclude that a deeper correction was imminent. The breach of support levels led to a rapid increase in bearish sentiment.
- The Formation of a Higher Low: Despite the selling pressure, the market managed to find a floor around the $62,400 mark. This formation of a "higher low" was the first technical signal that the sellers were losing their grip on the momentum.
- The Reclaim of the $63,500 Zone: Bitcoin subsequently climbed back to trade in the $64,300 region, successfully reclaiming the $63,500 support zone. This reclamation is widely viewed by analysts as the "line in the sand" that separates a temporary consolidation from a failed breakdown.
- The Shift in Positioning: With the reclaim of $63,500, traders have begun to adjust their risk-to-reward ratios. The focus has shifted from managing downside risk to identifying the next major "liquidity magnet" for potential short-squeezes.
Supporting Data: Liquidation Mapping and Market Dynamics
The current analytical approach relies heavily on liquidation maps—a tool that visualizes where leveraged traders are most vulnerable to being "liquidated" (forced out of their positions).
Precision Trading via Liquidity Clusters
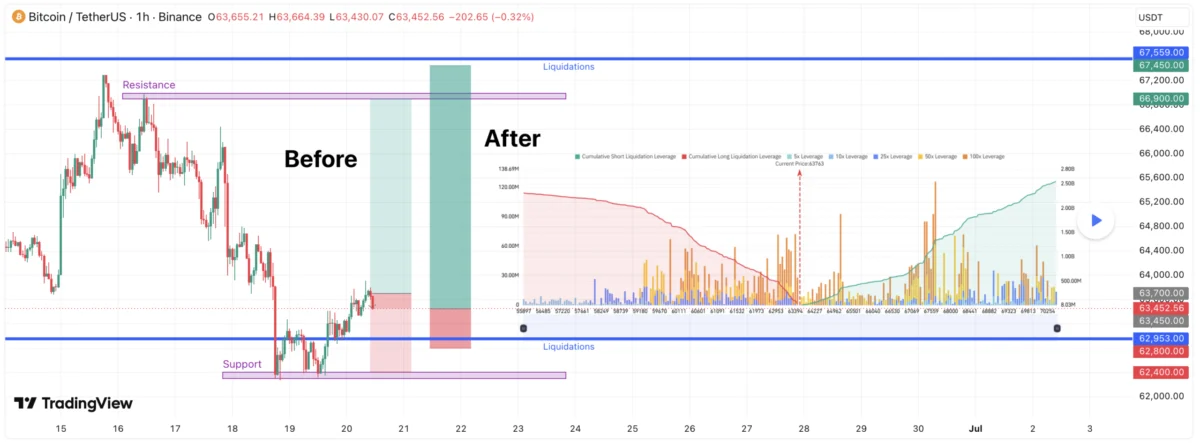
Recent analysis, notably from TradingView contributor kiv1n, suggests that traditional support and resistance lines are no longer sufficient in the current high-frequency environment. By analyzing the density of long and short liquidations, traders are recalibrating their entries and exits.
The refined strategy involves an entry point at approximately $63,450. The stop-loss, a critical component of risk management, has been strategically placed at $62,800. The logic behind this placement is rooted in the presence of a localized cluster of long liquidations near $62,953. By placing the stop-loss just below this cluster, traders are protecting themselves against a "stop-run"—a scenario where the market dips just low enough to trigger stop-losses before reversing upward. If the price falls below $62,800, it would effectively signal that the market is not merely correcting, but entering a deeper flush.
Targeting the "Liquidity Magnet"
On the upside, the target has been adjusted to $67,450. This is not an arbitrary number; it is calculated based on a massive liquidity cluster located at $67,559. The strategy here is to "front-run" the liquidity, capturing profits just before the market reaches the point where a short-squeeze might naturally exhaust itself. This method acknowledges that large-scale liquidity zones often act as magnets for price action before triggering a reversal.

Expert Perspectives and Market Commentary
The technical view of the $63,500 reclaim is bolstered by commentary from prominent market observers, including That Martini Guy on social media platform X. His assessment highlights a fundamental disconnect between market reality and trader perception.
According to his analysis, many market participants had become overly convinced that the previous breakdown was the start of a prolonged decline. However, the sequence of reclaiming the failed support area and grinding higher demonstrates that the "bearish narrative" was premature. The core takeaway from his analysis is that as long as $63,500 remains intact as support, the short-term bullish structure remains valid, making the $67,200 range high the next inevitable point of interest for the bulls.
Implications for Future Price Action
The implications of this setup are twofold: one for the short-term trader and one for the medium-term market structure.
The Case for a Short-Squeeze
If the current support levels hold, the next phase of the recovery could be a classic short-squeeze. As the price grinds toward the $67,000 region, traders who are currently holding short positions will be forced to cover, creating a self-reinforcing upward momentum. The liquidation maps suggest that there is significant "fuel" for such a move, provided the buyers remain disciplined and do not allow the price to dip back below the established support clusters.
The Risk of a Failed Recovery
Conversely, the bullish case is far from risk-free. The primary danger lies in a "sweep of the wrong side." If the market moves to clear the liquidity above $67,000 before establishing a firm base, the subsequent pullback could be violent. Furthermore, a reclaim only holds significance if buyers show persistent intent on subsequent retests. If the $63,500 level is tested and fails to hold on high volume, the recent rebound will be confirmed as a "dead cat bounce," likely leading to a retest of lower support levels.
Conclusion: Watching the $62,800–$63,500 Corridor
The coming days will be decisive for Bitcoin. The current market environment requires a shift from reactive trading to proactive analysis. The $62,800–$63,500 corridor is the most critical zone in the market today. Investors should observe how price action behaves within this range:
- Bullish Scenario: If the market maintains support within this corridor, the probability of testing the $67,000 region increases.
- Bearish Scenario: A breakdown below $62,800 would likely invalidate the current bullish setup, shifting the focus to liquidity zones lower on the chart and potentially extending the duration of the current consolidation phase.
In summary, while Bitcoin has successfully navigated a difficult period of uncertainty, the path forward remains narrow. The market is not yet in a state of unbridled growth; rather, it is in a state of controlled, data-driven recovery. By focusing on liquidity rather than simple price levels, traders are navigating the complexities of the current market with increased precision, awaiting confirmation that the bulls have indeed reclaimed control of the narrative.
This analysis is intended for informational purposes and does not constitute financial advice. Investors should perform their own due diligence and consider the high volatility inherent in cryptocurrency markets.
