
Executive Summary
As the second quarter of the year draws to a close, the cryptocurrency market finds itself at a precarious juncture. Bitcoin (BTC), the market’s primary bellwether, is currently navigating a period of significant structural vulnerability. With the asset hovering precariously near the $59,000 to $60,000 support band, traders and institutional analysts alike are scrutinizing the data for signs of a deeper trend reversal or a potential base-building phase. This report synthesizes the current market technicals, the implications of consecutive quarterly losses, and the vital importance of separating verifiable on-chain data from speculative market noise.
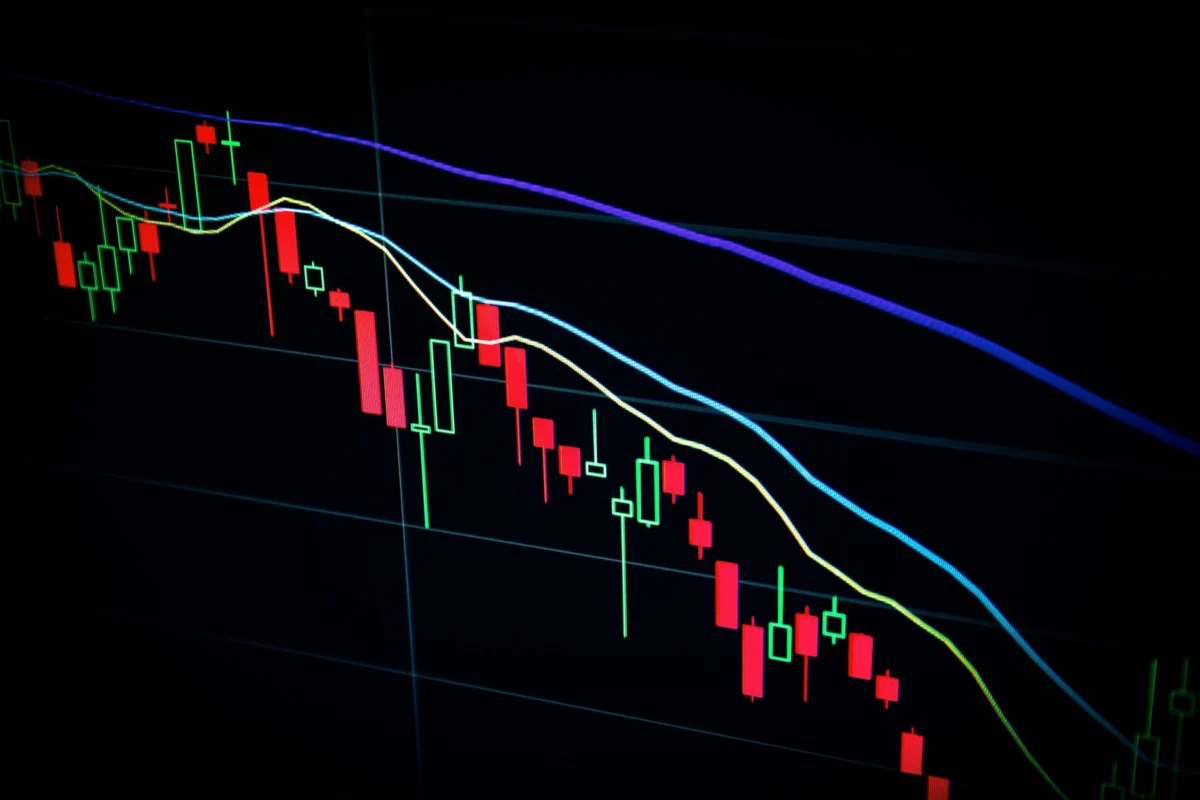
The Current State of the Market: A Fragile Equilibrium
The prevailing market sentiment has shifted from the high-octane optimism seen in the early months of the year to a more cautious, data-driven approach. Bitcoin’s inability to decisively reclaim the $65,000 level has left the market susceptible to downward pressure, resulting in a rare back-to-back quarterly decline.
For the seasoned trader, the current price action is not merely a number on a chart; it is a signal of shifting liquidity dynamics. As trading volumes thin during specific sessions, the market’s sensitivity to large-scale wallet movements and derivative liquidations increases. The $59,000 zone represents more than just a technical floor—it is a psychological and structural barrier that, if breached, could force a re-evaluation of the long-term bullish thesis that has defined much of the 2024 fiscal year.
Chronology of the Q2 Downturn
To understand where the market is headed, one must first analyze the trajectory that brought us to this point.
Early Q2: The Post-Halving Reset
Following the Bitcoin halving event in April, expectations of an immediate "supply shock" rally were high. However, the market entered a period of consolidation. As the halving-induced enthusiasm waned, the focus shifted toward macroeconomic indicators and the sustainability of ETF inflows.
Mid-Q2: The Liquidity Squeeze
Throughout May and June, liquidity across major centralized exchanges—such as Binance and Coinbase—began to ebb. This "thinning" of the tape meant that even moderate sell-side pressure could disproportionately impact price discovery. During this period, Bitcoin fluctuated within a defined range, struggling to find a catalyst to break above the $70,000 resistance.
The Q2 Close: Testing the Foundation
As June concludes, Bitcoin’s failure to maintain its momentum has resulted in a quarterly close in the red. This marks a rare occurrence of back-to-back quarterly losses, a development that historically signals a pause in institutional accumulation and a potential cooling-off period for retail sentiment. The current focus is entirely on the $59,000 support level; a failure to hold this zone could signal a shift in the quarterly market structure, moving from a neutral-to-bullish phase into a period of prolonged redistribution.
Supporting Data: Beyond the Price Ticker
When the market becomes volatile, the temptation to rely on emotional narratives is high. However, professional market analysis requires a reliance on verifiable data points.
1. On-Chain Flow Analysis
One of the most critical metrics currently being tracked is the movement of BTC between cold storage and exchange wallets. While some analysts interpret any movement toward an exchange as an intent to sell, the data is rarely that binary. On-chain analysis shows that institutional-grade entities often move assets for liquidity management, collateralization for derivatives, or internal rebalancing.
2. Derivative Positioning
The funding rates across major perpetual futures markets have fluctuated wildly, reflecting the uncertainty of traders. A neutral funding rate is often a sign of a healthy market, but current volatility has seen these rates swing, suggesting that speculative positioning is increasingly short-term in nature.
3. Institutional ETF Dynamics
A common point of contention is the role of Spot Bitcoin ETFs. While headlines often sensationalize net outflows, it is essential to look at the net flows as a percentage of total Assets Under Management (AUM). To date, the data suggests that while some profit-taking has occurred, the broader institutional trend remains one of long-term allocation rather than a mass exodus.
Implications for the Broader Crypto Ecosystem
Bitcoin’s performance acts as the tide that lifts or lowers all boats. The current structural weakness is having a cascading effect on the broader cryptocurrency ecosystem.
Altcoin Sensitivity
Altcoins, which have historically shown a high correlation with Bitcoin, are currently exhibiting heightened sensitivity to the flagship asset’s volatility. When Bitcoin enters a period of uncertainty, capital flows typically rotate into "risk-off" assets or stablecoins, leaving the altcoin market vulnerable to deeper corrections.
The Institutional Narrative
Institutional participants are rarely swayed by short-term price swings. Instead, they look at the maturity of the market’s infrastructure. The availability of custodial solutions, regulatory clarity, and the integration of Bitcoin into traditional financial portfolios are the factors that will ultimately dictate the long-term trend. The current "red" quarter should be viewed not as a failure of the asset class, but as a necessary phase of price discovery in a maturing global financial instrument.
What Traders Should Avoid Assuming
In the world of financial journalism, it is as important to state what is not happening as it is to state what is.
- Avoid the "Bear Market" Trap: A single quarter of negative performance does not constitute a systemic shift into a bear market. Market cycles are composed of both expansion and contraction; defining the current situation as a terminal downturn is a premature conclusion that ignores the broader macro-economic context.
- Don’t Over-Interpret ETF Outflows: As noted, viewing ETF outflows as a sign of permanent retreat is a logical fallacy. Institutional strategies are multi-faceted and often involve hedging, rebalancing, and tax-loss harvesting—none of which necessarily indicate a lack of long-term conviction.
- The Fallacy of Guaranteed Support: While $59,000 is a significant technical support zone, no level is infallible. Technical analysis provides probabilities, not certainties. Traders must maintain a risk-management framework that accounts for the possibility of a breach of support rather than betting the farm on a "guaranteed" bounce.
Verification and Future Path
For those seeking to navigate this period of uncertainty, the following steps are essential for verifying market signals:
- Direct Chart Validation: Utilize platforms like TradingView to overlay historical support levels with current volume profiles. Pay attention to "volume nodes" where the most trading activity has occurred, as these act as stronger support than simple trend lines.
- Cross-Exchange Comparison: Relying on a single exchange for price data can be misleading. Always cross-reference price action between Binance, Coinbase, and Kraken to ensure the move is systemic and not a result of localized liquidity issues or "fat-finger" trades.
- Monitor Official Updates: Market sentiment is often influenced by external news, from regulatory announcements to developer updates on the Bitcoin network. Distinguish between substantive updates—such as security patches or protocol upgrades—and speculative hype.
A Note on Weekend Volatility
It is a well-documented phenomenon that liquidity often thins over the weekend, leading to exaggerated price movements. Traders should be particularly cautious when interpreting Sunday night or Monday morning price action. Before making any definitive claims about a market shift, it is prudent to wait for the opening of the traditional global financial markets, which provides a more accurate picture of institutional liquidity and sentiment.
Conclusion
The close of the second quarter provides a rare and valuable data point for investors: a back-to-back quarterly loss for Bitcoin. While this signals a weakening in the immediate market structure, it is not necessarily a harbinger of doom. Instead, it is a period of transition that requires investors to be more diligent, more data-focused, and more disciplined in their risk management.
By separating the measurable, on-chain realities from the speculative noise, participants can better navigate the $59,000 to $60,000 support test. The market remains in a state of development, and as such, the ability to interpret these signals with clarity will be the defining characteristic of successful participants in the months to come.
Disclaimer: This report is based on publicly available market data and is intended for informational purposes only. It does not constitute financial advice. Always conduct your own research and consult with a qualified financial advisor before making investment decisions.
