


The digital asset market is currently witnessing a period of intense scrutiny and anticipation as XRP, the native cryptocurrency of the Ripple network, attempts to consolidate its recent gains. Following a period of sluggish performance, XRP has demonstrated a renewed sense of bullish momentum, successfully breaching the $1.1650 support level. As investors look toward the $1.20 psychological threshold, market participants are weighing the implications of this technical breakout against broader macroeconomic trends affecting the cryptocurrency ecosystem.
Main Facts: The Current Market State
XRP has emerged from a period of consolidation, establishing a clear upward trajectory that mirrors the movements of larger market cap assets like Bitcoin and Ethereum. After reclaiming the $1.1450 and $1.1500 zones, the asset saw a rapid surge in buying pressure, pushing it past the pivotal $1.1680 resistance level.
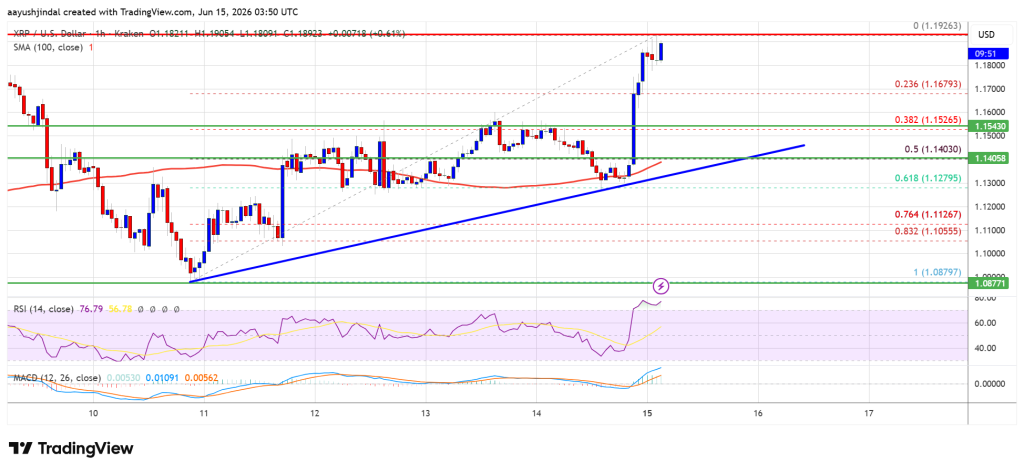
The current market structure reveals a high point established at $1.1926. Since reaching this peak, the asset has entered a consolidation phase, trading comfortably above the 23.6% Fibonacci retracement level—calculated from the swing low of $1.0879 to the recent high. This stability suggests that the market is currently digesting the recent influx of capital, with bulls attempting to build a foundation for a sustained push toward the $1.20 target.
Chronology of the Recent Rally
The recent price action for XRP did not occur in a vacuum. The rally began with a concerted effort to break through stagnant resistance levels that had hampered growth for several weeks.

- Initial Breakout: XRP successfully cleared the $1.1450 resistance, signaling a shift in sentiment from neutral to bullish.
- Momentum Building: The asset gained significant pace as it crossed the $1.1680 mark, effectively flipping this previous resistance into a new support floor.
- Testing Highs: During a period of heightened volume, bulls successfully pushed the price toward the $1.1880 zone, eventually peaking at $1.1926.
- Consolidation Phase: Following the peak, the market entered the current phase of sideways movement, oscillating around the $1.180 level while holding above the 100-hourly Simple Moving Average (SMA).
This timeline reflects a healthy, albeit volatile, accumulation pattern, where short-term profit-taking is being met with consistent demand from market participants looking to capitalize on the ongoing momentum.
Supporting Technical Data
A deep dive into the technical indicators paints a nuanced picture of the asset’s current standing. The hourly chart reveals a bullish trend line forming with support established at the $1.140 mark. This trend line serves as a critical safety net for traders; as long as the price maintains its position above this level, the bullish thesis remains intact.
Furthermore, the integration of moving averages provides confidence to the bulls. The price is currently trading above the 100-hourly SMA, a hallmark of an established short-term uptrend.
Key Technical Indicators:
- Hourly MACD (Moving Average Convergence Divergence): The MACD line is currently gaining momentum within the bullish zone, indicating that the strength of the buying pressure is increasing relative to recent sessions.
- Hourly RSI (Relative Strength Index): The RSI is currently situated above the 50 level, suggesting that market participants are leaning toward a "buy" sentiment without having pushed the asset into an "overbought" territory, which often precedes a sharp correction.
Navigating Future Resistance and Support
The road to $1.20 is fraught with technical hurdles. The immediate resistance lies at $1.1920. Should the bulls manage to clear this, the next major milestone is $1.1950. A decisive close above $1.20 would be the ultimate validation of the current trend, potentially opening the door for an ascent toward $1.2150 and eventually the $1.2220 mark.

Conversely, the downside risk cannot be ignored. If the market fails to breach the $1.20 barrier, a rejection could trigger a swift correction. The first line of defense on the downside is the $1.1680 level. If this support collapses, the asset is likely to retreat toward the $1.1550 zone. A breakdown below this level would bring the $1.1400 trend line back into focus. In a worst-case scenario, failing to hold the 50% Fibonacci retracement level could force a retest of the $1.1280 support, with the primary floor sitting at $1.080.
Implications for Investors and the Market
The current price action surrounding XRP carries significant implications for the broader cryptocurrency market. For one, it highlights the continued correlation between XRP and the wider market indices. When Bitcoin and Ethereum show strength, XRP often follows, but the specific resistance levels faced by XRP demonstrate its unique internal supply-demand dynamics.
For institutional and retail investors, this consolidation phase is a critical "watch and wait" period. The ability of the asset to maintain its position above the $1.1680 support suggests that there is strong institutional interest in preventing a major slide. However, the lack of a sustained move above $1.20 indicates that the market is waiting for a catalyst—whether it be a positive regulatory update, a shift in broader economic policy, or a surge in trading volume—to confirm the next leg of the cycle.
The technical setup currently favors the bulls, but the volatility inherent in the cryptocurrency market suggests that traders should prioritize risk management. Setting stop-loss orders around the $1.1550 level could provide a safeguard against sudden, unexpected volatility. Meanwhile, those looking for long-term growth may view the current consolidation as a potential entry point, provided the trend line at $1.140 holds firm.
Conclusion: A Delicate Balance
XRP is currently positioned at a crossroads. The transition from a bearish or stagnant trend to a bullish breakout has been executed with technical precision, but the final ascent toward $1.20 remains the definitive test for the bulls.
As always, market participants must remain cognizant of the fact that technical analysis serves as a tool for mapping probability rather than predicting certainty. The interplay between the $1.1920 resistance and the $1.1400 support will likely define the market’s trajectory in the coming days. Investors are encouraged to monitor these levels closely, ensuring that their strategies remain aligned with the evolving data and the broader, often unpredictable, currents of the global financial landscape.
Disclaimer: The information provided in this analysis is for educational purposes only and does not constitute financial advice. Investing in cryptocurrencies involves substantial risk. Always conduct your own research and consult with a qualified financial advisor before making any investment decisions.
