

Dogecoin (DOGE), the world’s most prominent "memecoin," has once again found itself in the spotlight as it attempts to claw back ground against the US Dollar. After finding a stable footing near the $0.0850 support zone, the asset has initiated a fresh recovery phase. However, market analysts remain cautious, noting that while the recent price action mirrors broader trends seen in major assets like Bitcoin and Ethereum, the structural integrity of this rally is currently being tested by significant overhead resistance.
As of the latest market data, DOGE has successfully reclaimed the $0.0870 level, signaling a renewed, albeit tenuous, interest from retail and institutional participants. Yet, the path forward is fraught with technical hurdles that will determine whether this movement is the beginning of a sustained trend or merely a temporary fluctuation in a volatile market.
The Chronology of the Recent Move
The current price trajectory of Dogecoin can be traced back to the consolidation period observed around the $0.0850 price floor. Over the past several trading sessions, DOGE began to show signs of life, tracking the positive momentum observed across the wider cryptocurrency sector.
Phase 1: Finding the Floor
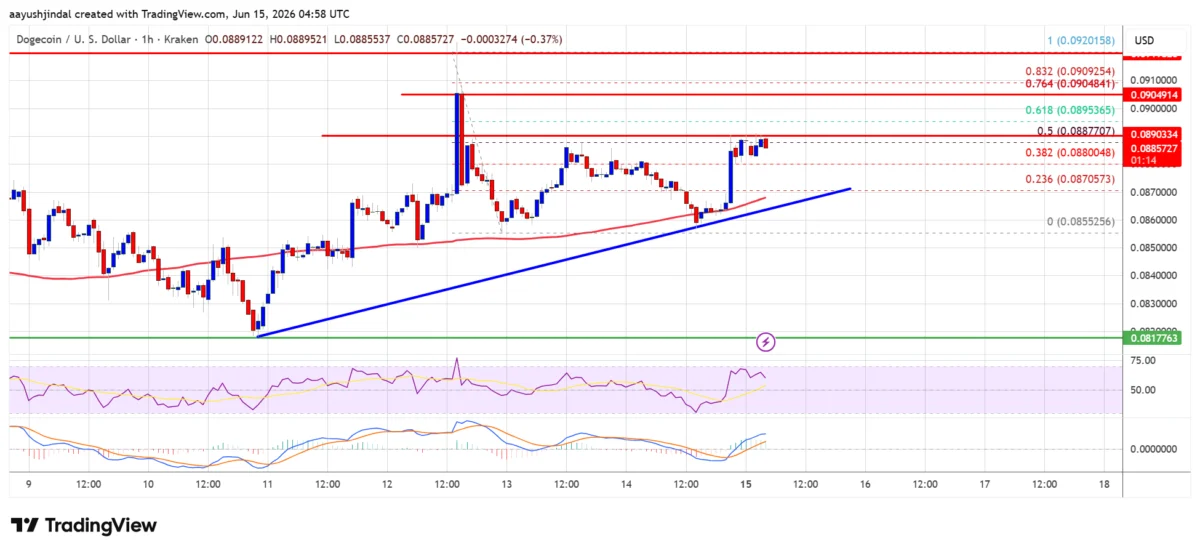
Following a descent from a local swing high of $0.0920, Dogecoin experienced a period of selling pressure that bottomed out at $0.0855. This zone became a critical psychological and technical support level. The ability of the bulls to defend this line prevented a deeper slide toward the $0.0800 threshold, establishing a base from which the current recovery began.
Phase 2: The Rebound
With the support established, DOGE initiated a bullish recovery, moving past the initial resistance levels of $0.0865 and $0.0870. This movement was characterized by a 2% gain, effectively pushing the price above the 38.2% Fibonacci retracement level—a key indicator often used by traders to gauge the strength of a reversal. During this time, a bullish trend line began to form on the hourly chart, providing a secondary layer of structural support at the $0.0870 mark.

Phase 3: Current Stagnation
Currently, the price is oscillating near the $0.0890 to $0.0900 range. The market is witnessing a battle between buying momentum and profit-taking at these levels. The 100-hourly simple moving average acts as a dynamic support, but the resistance at the 50% Fibonacci retracement level (from the $0.0920 high to the $0.0855 low) is proving difficult to breach on the first attempt.
Supporting Data: Technical Analysis Breakdown
To understand the fragility of the current rebound, one must examine the underlying technical indicators that define the current trading environment.
Moving Averages and Trend Lines
The price is currently trading above its 100-hourly simple moving average (SMA). In technical analysis, holding above this SMA is generally viewed as a positive sign for short-term sentiment. However, the presence of a bullish trend line at $0.0870 is the most critical feature of the hourly chart. Should the price dip below this trend line, it would likely invalidate the current recovery thesis.
The MACD and RSI Indicators
- Hourly MACD: The Moving Average Convergence Divergence (MACD) indicator is currently showing a loss of momentum within the bullish zone. This suggests that while buyers are still in control, their conviction is waning as the price approaches major resistance.
- Hourly RSI: The Relative Strength Index (RSI) remains above the 50-level threshold. While this indicates a neutral-to-bullish bias, it is not yet in overbought territory, suggesting there is room for movement—provided that volume supports a breakout.
Fibonacci Retracement Levels
The Fibonacci levels provide a roadmap for the coming days:
- The 50% Retracement: Currently positioned near $0.0890, this represents the immediate barrier for the bulls.
- The 61.8% Retracement: Serving as a gateway to higher valuations, a break above this level is often considered a "golden" signal for a sustained trend reversal.
The Path Forward: Scenarios for Investors
Market participants are currently weighing two primary scenarios: a breakout toward the $0.10 psychological barrier or a retest of lower supports.

Bullish Case: The Push for $0.10
If the buying pressure continues, the first major hurdle for the bulls is the $0.0905 level. A decisive close above this, followed by a move past the $0.0920 resistance, would likely open the door for a rally toward $0.0950. The ultimate objective for the bulls in the short-to-medium term remains the $0.1000 to $0.1050 range. Achieving this would require a significant influx of trading volume, likely fueled by broader market optimism or a catalyst in the social sentiment surrounding Dogecoin.
Bearish Case: The Risk of Reversal
Conversely, should the price fail to break above the $0.0900 resistance, the risk of a "fake-out" increases. If the price slips below the $0.0870 support, the immediate next stop is $0.0855. A breakdown below this point—specifically if it fails to hold at $0.0850—would likely trigger stop-loss orders, potentially accelerating a decline toward the $0.0820 support level and testing the $0.0800 floor once again.
Implications for the Broader Cryptocurrency Market
The behavior of Dogecoin is often viewed as a proxy for speculative interest within the crypto markets. Because DOGE is highly sensitive to social media sentiment and retail liquidity, its performance can offer clues about the risk appetite of the broader investor base.
A failure to hold current levels could signal that retail investors are currently risk-averse, preferring to park capital in larger, more established assets like Bitcoin or even stablecoins. Conversely, a breakout for Dogecoin often precedes "altseason" dynamics, where speculative capital rotates into smaller-cap tokens. Consequently, traders are keeping a close eye on the $0.0850 support level, as it serves as a litmus test for the health of the current market rally.
Professional Perspective: Navigating Volatility
As highlighted by senior market analysts, the current state of the market is defined by uncertainty. When dealing with assets like Dogecoin, which are characterized by high volatility, technical analysis serves as a guide rather than a guarantee.
Investors are reminded that while charts can identify key support and resistance levels, they cannot predict the external catalysts—such as regulatory shifts, macroeconomic reports, or unexpected news cycles—that often dictate price action in the crypto space.
Risk Management Strategy
For those looking to trade these levels, a disciplined approach is essential:
- Stop-Loss Placement: Given the fragility of the current rebound, placing stop-losses just below the $0.0850 support is a common strategy for risk mitigation.
- Monitoring Volume: A price breakout that occurs without a corresponding increase in trading volume is often considered "hollow" and prone to reversal.
- Market Correlation: Keep an eye on Bitcoin’s dominance. If Bitcoin faces a significant correction, it is highly probable that Dogecoin will follow suit, regardless of its own local technical setup.
Final Summary of Key Levels
| Level Type | Price Point |
|---|---|
| Major Resistance | $0.0900, $0.0920, $0.1000 |
| Major Support | $0.0870, $0.0855, $0.0850 |
In conclusion, Dogecoin is currently navigating a precarious technical landscape. While the initial recovery from $0.0850 has provided a glimmer of hope for the bulls, the lack of momentum in the MACD and the looming resistance at $0.0900 suggest that the asset is not yet out of the woods. Traders and investors alike should approach the coming sessions with caution, focusing on the $0.0870 trend line as the primary indicator for short-term market direction.
Disclaimer: The information provided in this article is for educational and informational purposes only. It does not constitute, and should not be construed as, financial or investment advice. Cryptocurrency trading involves significant risk, and the volatility of the market can lead to substantial losses. Always conduct your own thorough research and consult with a qualified financial advisor before making any investment decisions. The views and opinions expressed in this article are those of the authors and do not necessarily reflect the official policy or position of the publication.
