

Executive Summary: The Current State of DOGE
Dogecoin (DOGE), the world’s leading memecoin by market capitalization, has recently exhibited signs of a tentative recovery. After establishing a localized floor near the $0.0850 zone against the US Dollar, the asset has managed a modest uptick, reflecting a broader sentiment shift observed across major cryptocurrencies like Bitcoin and Ethereum. However, market analysts remain cautious. While the technical setup suggests a potential for further upside, the "fragile" nature of this rebound—characterized by thin volume and immediate resistance hurdles—indicates that the path to a sustained bull run remains fraught with volatility.
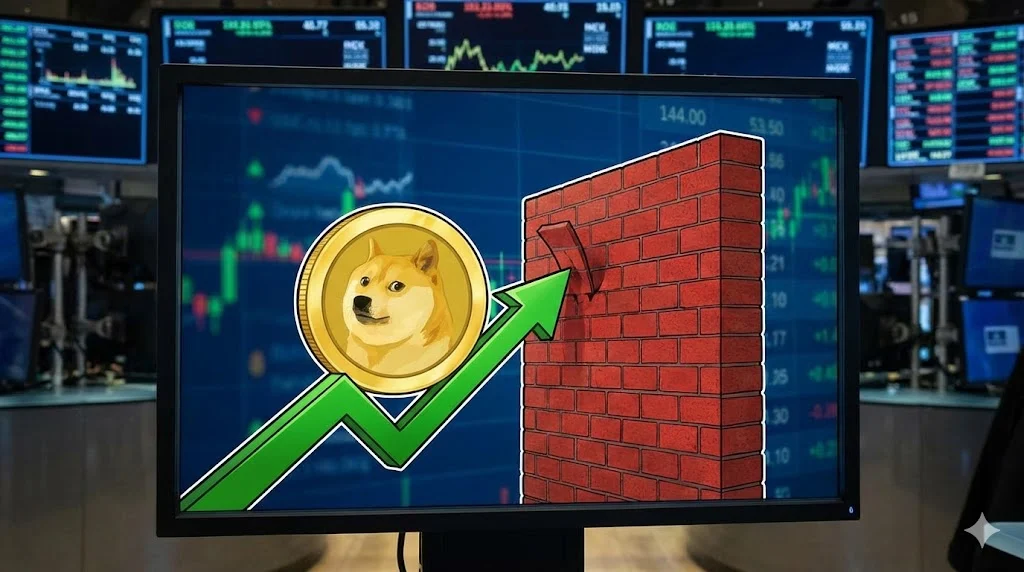
Currently, DOGE is testing the $0.090 psychological barrier. Whether it can breach this level or succumb to selling pressure will likely dictate its trajectory for the coming week.
Chronology of Recent Market Movements
To understand the current positioning of Dogecoin, it is essential to look at the recent price action that led to the present impasse.
The Breakdown and Consolidation
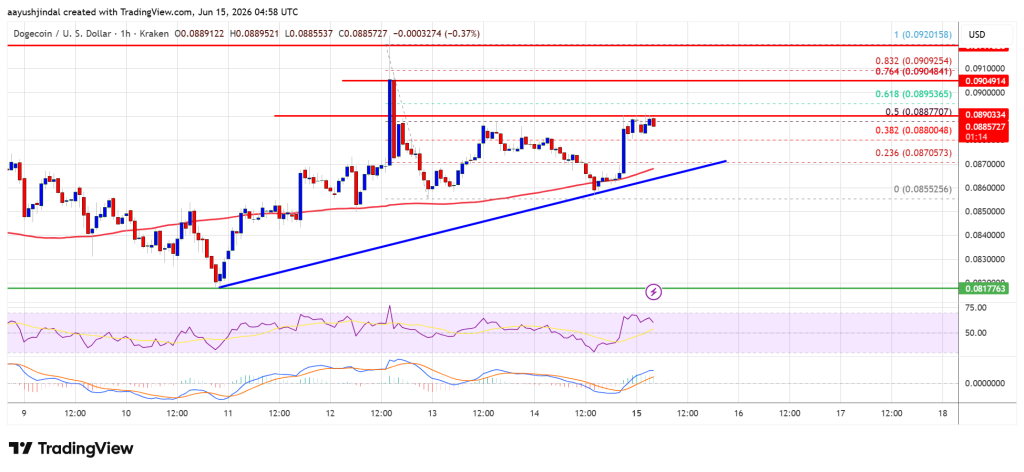
In the preceding weeks, Dogecoin faced significant bearish pressure, mirroring a general contraction in the altcoin sector. The asset slipped from a swing high of $0.0920, experiencing a steady decline that culminated in a support test at the $0.0850 level. This level proved critical, as it acted as a psychological and technical bedrock, preventing a deeper capitulation toward the $0.0800 mark.
The Initial Rebound
Following the successful defense of the $0.0850 support, buying interest materialized. Over the last 48 hours, DOGE climbed above key resistance levels at $0.0865 and $0.0870. This move was accompanied by a modest increase in trading volume, suggesting that institutional and retail interest remains alive, albeit cautious. The asset successfully reclaimed the 100-hourly simple moving average (SMA), a technical signal often used by traders to identify a shift in short-term momentum.

Supporting Data and Technical Indicators
A thorough examination of the current chart patterns provides a roadmap for both bullish and bearish scenarios.
Fibonacci Retracement Analysis
The price action is currently hovering between the 38.2% and 50% Fibonacci retracement levels of the recent downward move from the $0.0920 swing high to the $0.0855 low.
- The 38.2% Level: Successfully cleared, this provided the initial momentum for the current recovery.
- The 50% Level: Currently acting as a stiff resistance point near $0.0890–$0.0900. A definitive close above this zone is required to confirm a trend reversal.
Moving Averages and Trends
The formation of a bullish trend line on the hourly chart, with support anchored at $0.0870, provides a buffer for the bulls. As long as the price stays above this trend line, the narrative remains constructive. However, the hourly Moving Average Convergence Divergence (MACD) is beginning to show signs of fading momentum. While still in the bullish zone, the narrowing histogram suggests that the immediate "buy-the-dip" frenzy is cooling off.
Relative Strength Index (RSI)
The RSI currently sits above the 50 mark, indicating that bulls are in control of the immediate momentum. However, it is not yet in "overbought" territory, which leaves room for further growth should buying pressure intensify. Conversely, if the RSI dips back below 50, it would signal a return of dominance to the bears.
Implications of the $0.090–$0.0920 Resistance Cluster
The $0.090 to $0.0920 range represents a significant "sell wall." Many traders who entered positions during previous spikes are likely looking to break even or take profits, creating a natural supply ceiling.

- Bullish Scenario: A decisive breakout above $0.0920 would invalidate the recent bearish structure. This could trigger a "short squeeze," forcing bearish traders to cover their positions, potentially fueling a rally toward $0.0950 and eventually the $0.1000 psychological milestone.
- Bearish Scenario: If the bulls fail to flip the $0.090 resistance into support, the asset is at risk of a retest of the $0.0870 and $0.0850 support levels. A breakdown below $0.0850 would be highly consequential, likely triggering a cascade of sell orders that could drive the price down to $0.0820 or even $0.0800.
Market Sentiment and Expert Perspectives
Financial experts and market analysts, such as senior market strategist Aayush Jindal, emphasize the importance of context. In the volatile landscape of cryptocurrency, technical analysis serves as a lens, but external macroeconomic factors—such as interest rate expectations, regulatory updates, and Bitcoin’s performance—often dictate the broader trend.
The current "fragile" nature of the rebound reflects a market waiting for a catalyst. Dogecoin, being a high-beta asset, often reacts with amplified sensitivity to market-wide volatility. While the current technical setup shows a path forward, investors are advised to prioritize risk management. The intersection of software-driven trading algorithms and retail sentiment makes Dogecoin a "fast-mover," where stop-loss orders are essential for capital preservation.
Strategic Outlook: What Should Investors Watch?
For those monitoring the DOGE/USD pair, the following levels are paramount for the next 24 to 72 hours:
- Primary Resistance: $0.0900 (Immediate hurdle), $0.0920 (Trend pivot), $0.1050 (Long-term target).
- Primary Support: $0.0870 (Near-term trend line), $0.0855 (Intermediate support), $0.0850 (The "Must-Hold" zone).
Investors should pay close attention to trading volume. A price increase on low volume is rarely sustainable and often precedes a "bull trap." Conversely, a breakout accompanied by a spike in volume provides a much higher degree of confidence in a sustained move.
Conclusion: Caution Amid Potential
Dogecoin’s recent price action is a classic study in market consolidation. The asset is currently navigating a narrow corridor between established support and formidable resistance. While the recovery from the $0.0850 level has been orderly and technically sound, the lack of explosive momentum serves as a reminder that the broader market remains in a state of flux.
The outlook for the remainder of the week is cautiously optimistic, provided that the support at $0.0870 remains intact. However, in the realm of digital assets, the situation can change in a heartbeat. Traders should avoid over-leveraging and maintain a disciplined approach to their entries and exits. As always, the cryptocurrency market demands a balance between technical vigilance and an understanding of the inherent risks involved in speculative trading.
Disclaimer: The information provided in this article is for educational and informational purposes only. It does not constitute financial, investment, or trading advice. Cryptocurrencies are highly volatile assets, and the value of your investment may fluctuate significantly. You are encouraged to perform your own due diligence and consult with a qualified financial advisor before making any investment decisions. NewsBTC and its contributors are not responsible for any financial losses incurred based on the information provided herein.
