
The cryptocurrency market continues to present a dynamic landscape for technical traders, with Bitcoin (BTC) frequently establishing well-defined structural patterns that dictate short-to-medium-term price action. A recent technical analysis shared by market analyst heniitrading on TradingView offers a constructive, tactical outlook for the BTC/USDT pair.
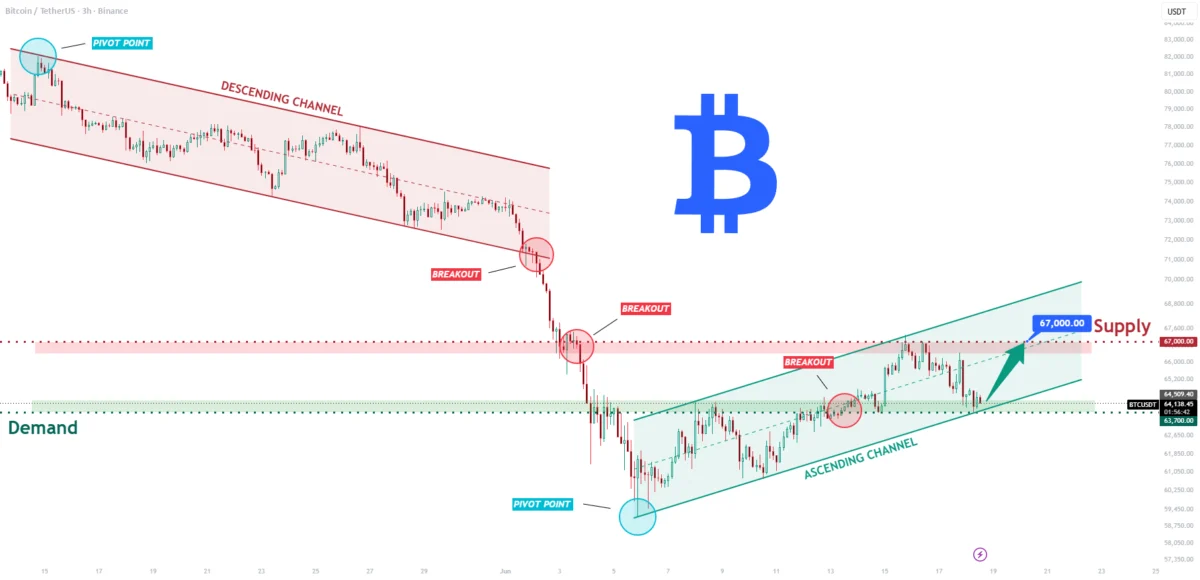
According to the analysis, Bitcoin has successfully transitioned from a corrective descending channel into an ascending channel, marking a critical shift in market momentum. As the digital asset navigates this newly formed bullish structure, market participants are closely watching key technical boundaries that will likely determine Bitcoin’s trajectory in the coming days.
1. Main Facts: The $63,700 to $67,000 Tactical Battleground
At the core of this technical setup is a highly structured range bounded by two critical price levels: a robust demand zone at approximately $63,700 and a formidable supply zone at $67,000. The behavior of BTC/USDT within this corridor provides day traders and swing traders alike with clear, actionable parameters.
       [ Supply Zone: $67,000 ]  <-- Major resistance / Profit-taking target
                 ▲
                 │   (Ascending Channel / Bullish Momentum)
                 │
       [ Demand Zone: $63,700 ]  <-- Critical support / Invalidation level
The Role of the $63,700 Demand Zone
The $63,700 level serves as the primary defensive line for bullish market participants. In technical analysis, a demand zone represents an area where buying interest is sufficiently strong to overcome selling pressure, temporarily halting a decline or initiating a price reversal. For the current ascending channel to remain valid, buyers must consistently defend this support. A sustained daily close below $63,700 would invalidate the constructive short-term thesis, signaling that the recent upward momentum has stalled or failed.
The Significance of the $67,000 Supply Zone
Conversely, the $67,000 region represents the immediate target for buyers. This supply zone is characterized by historical order blocks where sellers have previously stepped in, creating overhead resistance. A successful retest of this zone would demonstrate the strength of the current bounce, though it does not guarantee an immediate, macro-scale breakout. Instead, it serves as a near-term objective where tactical traders are likely to realize profits or adjust their risk exposure.
2. Chronology of Price Action: Tracing the Shift in Momentum
Understanding how Bitcoin arrived at this pivotal junction requires a step-by-step examination of its recent price action. The transition from a bearish structure to a bullish channel developed across several distinct phases.
+------------------------+      +-------------------------+      +-------------------------+
| Phase 1: Descending    | ---> | Phase 2: Pivot Point    | ---> | Phase 3: Ascending      |
| Channel (Downtrend)    |      | Reversal & Breakout     |      | Channel (Recovery)      |
+------------------------+      +-------------------------+      +-------------------------+
Phase 1: The Descending Channel and Bearish Dominance
Prior to the current recovery, BTC/USDT was locked in a classic descending channel. This bearish pattern was characterized by a series of lower highs and lower lows, reflecting persistent distribution by sellers and a lack of sustained buying conviction. During this phase, rallies were consistently met with selling pressure at the upper boundary of the channel, keeping the asset on a downward trajectory.
Phase 2: The Pivot Point Reversal
The trend shifted when Bitcoin reached a major pivot point at the lower extremity of its corrective range. At this juncture, selling pressure became exhausted, and buyers stepped in with sufficient volume to absorb the remaining sell orders. This accumulation led to a sharp reversal, culminating in a decisive breakout above the descending channel’s upper resistance line.

Phase 3: Establishment of the Ascending Channel
Following the breakout, the price did not merely spike and collapse; instead, it began establishing higher highs and higher lows. This structured recovery formed the ascending channel highlighted in the analyst’s chart. The transition from a descending to an ascending channel is a classic signature of a momentum shift, confirming that buyers have taken short-term control of the market’s direction.
3. Supporting Data: Volume Profiles, Liquidity, and Technical Confluences
To evaluate the validity of this ascending channel setup, traders look to supporting market data, including volume distribution, order book liquidity, and momentum oscillators.
Volume Profile Visible Range (VPVR)
Analyzing the Volume Profile Visible Range (VPVR) reveals a significant high-volume node near the $63,700 level. This indicates that a substantial amount of trading activity has historically occurred at this price, making it a natural area of price agreement and strong support. Conversely, the gap between $64,000 and $66,500 exhibits relatively low volume density, suggesting that if bulls can successfully initiate a bounce from the bottom of the channel, the price could move rapidly through this low-liquidity void toward the $67,000 target.
Relative Strength Index (RSI) and Moving Averages
On the 4-hour and daily charts, technical indicators align with a constructive outlook:
- Relative Strength Index (RSI): The RSI has rebounded from near-oversold conditions (below 40) and is hovering in neutral territory, leaving ample room for an upward expansion before reaching overbought levels (above 70).
- Exponential Moving Averages (EMAs): The price is testing the 50-period and 200-period EMAs. Consolidating above these key moving averages would provide additional mechanical support for the move toward $67,000.
Weekend Liquidity Dynamics
Because this technical setup is highly tactical, weekend trading dynamics play a major role. Weekends typically experience lower trading volumes as traditional financial markets and institutional spot desks are closed. This reduction in liquidity can lead to exaggerated price movements and sudden "liquidity sweeps." Traders often utilize these well-defined channel boundaries to navigate weekend volatility, looking for clean bounces rather than anticipating major breakout moves during low-volume hours.
4. Market Perspectives: Analyst and Derivative Sector Responses
While the technical chart presents a clean visual setup, broader market perspectives from derivative traders and quantitative analysts provide crucial context.
Derivative Market Sentiment and Funding Rates
Data from crypto derivative analytics platforms reveals that funding rates for BTC perpetual swaps have remained relatively neutral to slightly positive. This indicates that while there is no excessive leverage-fueled euphoria in the market, there is a steady baseline of bullish interest.
A cluster of short liquidations is reportedly building just above the $67,000 mark. If buyers can push the price toward this supply zone, the forced buying from short-sellers covering their positions could accelerate the upward move, potentially overshooting the target toward $68,000.

Quantitative Analyst Commentary
Many institutional analysts view setups like the one proposed by heniitrading as essential risk-management tools rather than definitive directional predictions. One quantitative analyst commented on the setup:
"In a market characterized by macroeconomic uncertainty and shifting regulatory narratives, localized technical structures like ascending channels provide critical guardrails. The $63,700 level is not just a line on a chart; it represents a key psychological floor where spot buyers are currently willing to step in. If that floor cracks, it suggests a broader risk-off sentiment is taking hold."
5. Implications: The Broader Market and Altcoin Correlation
The resolution of this short-term channel bounce has significant implications not only for Bitcoin but also for the broader digital asset market.
                       ┌─── Breakout Above $67,000 ───► Target $70k+ / Altcoin Rally
                       │
[ BTC Price Action ] ──┤
                       │
                       └─── Breakdown Below $63,700 ──► Retest $60k / Market-wide Sell-off
The Bullish Scenario: Reaching and Exceeding $67,000
If Bitcoin successfully defends the $63,700 demand zone and climbs to the $67,000 supply zone, it will reinforce market confidence. A clean breakout above $67,000, backed by rising spot volume, would shift the narrative from a "tactical recovery" to a potential retest of the psychological $70,000 barrier.
Furthermore, a stable, climbing Bitcoin typically creates a favorable environment for altcoins. When Bitcoin consolidates or climbs steadily within an ascending channel, capital often rotates into higher-beta assets, sparking localized rallies across major altcoins and layer-1 tokens.
The Bearish Scenario: Breakdown and Invalidations
Should the market fail to sustain the $63,700 support, the ascending channel structure will be invalidated. Such a breakdown would likely trigger a cascade of stop-loss orders from late-joining long positions.
Under this scenario, the market would likely shift its focus back to deeper support levels, specifically the psychological $60,000 threshold and the key support blocks established during previous correction phases. A breakdown of this magnitude would also drag the altcoin market down, as capital flees to stablecoins or cash amid heightened risk aversion.
Conclusion: A Masterclass in Range Bound Execution
Ultimately, the BTC/USDT chart analyzed by heniitrading highlights the importance of structure over speculation. By identifying a clear demand zone at $63,700 and an upside target at $67,000, the analysis strips away market noise, leaving traders with a logical framework to manage risk, define stop-losses, and identify high-probability entry and exit points in an always-active market.
