

The digital asset landscape is currently gripped by a familiar sense of unease. As Bitcoin (BTC) struggles to maintain its footing above the psychological threshold of $60,000, investors find themselves at a critical crossroads. While some market participants view the recent weekend volatility as a "buy the dip" opportunity, seasoned technical analysts are sounding an alarm. Among them is market strategist Merlijn The Trader, who argues that the current market structure mirrors the deceptive accumulation patterns of 2022. According to his analysis, the true "bottom" has not yet been realized, and those rushing to deploy capital at current levels may be falling into a classic liquidity trap.
The Main Facts: A Market in Search of Direction
Bitcoin’s recent price action has been defined by a struggle between institutional liquidity and retail apprehension. Having dipped below the $60,000 mark during a volatile weekend session, the asset is currently fighting to reclaim its standing near the 200-week moving average. This specific technical indicator is widely regarded as a barometer for long-term health; falling beneath it historically signals a transition into a more prolonged bear market cycle.
At the time of writing, Bitcoin is trading at approximately $62,891. While this remains above the immediate danger zone of the $60,000 psychological support, analysts note that the volume accompanying the recent bounce is insufficient to confirm a trend reversal. The market is currently exhibiting the classic symptoms of "distribution disguised as accumulation," where short-term strength is systematically sold into by larger institutional players, leaving smaller retail investors holding the bag.
Chronology of the 2026 Correction
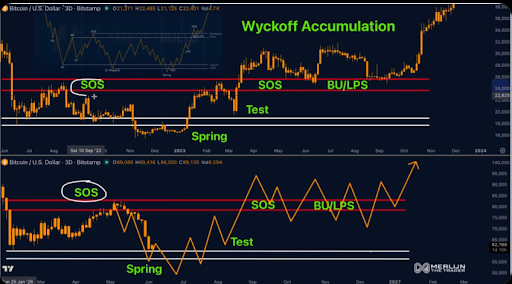
To comprehend the current trajectory of the Bitcoin market, one must look at the historical context of the 2022 bear market. During that period, the market bottomed out near $15,500. This low was followed by an aggressive recovery rally that propelled BTC toward $23,000. Many investors, fueled by optimism, interpreted this move as the official end of the crypto winter.
However, the reality proved far more painful. The market underwent a secondary wave of aggressive selling, known in technical parlance as a "re-test" or a "spring," which wiped out the gains of those who entered during the initial recovery.
Merlijn The Trader posits that 2026 is tracing a remarkably similar path. The current market has experienced a "sign of strength"—a brief rally that convinced many that the bottom was in—followed by a loss of momentum that mirrors the structural failures observed four years ago. The chronology of this cycle suggests we are currently in the pre-spring phase, a period characterized by high volatility and the deliberate exhaustion of bulls before the true accumulation window opens.
Technical Foundations: The Wyckoff Accumulation Model
The core of the current bearish outlook is rooted in the Wyckoff Accumulation Model, a framework developed by Richard Wyckoff in the early 20th century to analyze the lifecycle of market trends. The model is divided into five distinct phases:
Phase A: Stopping the Downtrend
This phase marks the transition from a supply-dominated market to a state of equilibrium. It typically involves a "Selling Climax" where panic selling is absorbed by institutional buyers.

Phase B: The Building of Cause
In this stage, institutions begin to accumulate positions within a defined trading range. This is often the longest phase and is characterized by "choppy" price action that shakes out weak hands.
Phase C: The Spring
This is the most critical phase for traders. It involves a final, sharp drop below the support level to capture liquidity and trigger stop-loss orders. This "shakeout" is intended to clear the market of remaining sellers before the upward trend begins in earnest.
Phase D & E: The Markup and Breakout
Following the spring, the price enters a "Last Point of Support" (LPS) before initiating a sustained, high-volume breakout (Phase E).
Merlijn’s analysis indicates that Bitcoin has yet to complete Phase C. By his estimation, a "Spring" to the $50,000 level is highly probable. This would not be a sign of the market failing, but rather a necessary structural event to flush out leverage before a more sustainable bull run can commence.
Supporting Data: Why $60,000 is a False Flag
The $60,000 level has become the focal point of the current debate, largely because of its status as a round number and its proximity to the 200-week moving average. However, historical data suggests that the market often treats these "obvious" support levels as liquidity pools.
When a large number of retail traders set their stop-losses just below a major support line, "smart money" often pushes the price through that level to trigger those orders. This generates the necessary sell-side volume for large entities to accumulate BTC at lower prices. Consequently, the $60,000 level may be serving as a psychological "trap" rather than a floor.
Furthermore, current on-chain metrics show a stagnation in new address creation and a decline in exchange inflows, suggesting that the "fear of missing out" (FOMO) that usually drives sustained rallies is absent. Without the influx of new retail capital, the price remains vulnerable to further downside pressure, especially as macroeconomic conditions—such as interest rate uncertainty and shifting regulatory policies—continue to influence global asset classes.
Official Responses and Institutional Sentiment
While retail analysts remain cautious, institutional sentiment remains bifurcated. Major hedge funds and ETF issuers continue to view Bitcoin as a long-term store of value, often framing dips as opportunities to increase holdings. However, their public statements often contrast with their trading behavior.
Many institutional desks have adopted a strategy of "buying the fear." While retail investors sell in panic as prices drop toward $50,000, these institutions are systematically scaling into positions. The divergence between the vocal optimism of crypto-native firms and the cautious, algorithmic approach of major financial institutions highlights the current lack of consensus in the market.
Implications: The Strategy for the Patient Investor
For the average investor, the implications of this analysis are clear: patience is the most valuable commodity in the current market. The urge to "buy the dip" at $60,000 is understandable, but it may prove to be premature.
Defining the DCA Zone
Merlijn The Trader has identified a specific Dollar-Cost Averaging (DCA) zone between $48,000 and $59,000. His argument is that this range offers the most statistically favorable risk-to-reward ratio for long-term holders. By waiting for the price to enter this zone, investors can avoid the "bull trap" of the $65,000-$70,000 range, where they would likely be buying into a rally that is destined to be sold off again.
The Dangers of Leverage
In a market characterized by Wyckoffian springs, the use of leverage is particularly perilous. Even if an investor is correct about the long-term direction of Bitcoin, a sudden drop to $50,000 (the Spring phase) could result in the total liquidation of leveraged positions. The prudent approach, therefore, is to prioritize capital preservation and accumulate spot positions during periods of maximum market despair.
Conclusion: The Path Ahead
The coming weeks will be decisive for Bitcoin. If the market fails to hold the current support levels, we should expect a testing of the lower bounds as outlined by the Wyckoff model. While the prospect of a drop to $50,000 may be distressing for those currently invested, it should be viewed as a structural necessity rather than a terminal event.
The history of Bitcoin is defined by its cycles of extreme volatility and its eventual emergence into new all-time highs. By understanding the structural phases of these cycles, investors can avoid the pitfalls that catch the majority of the market. The message from the charts is simple: the real opportunity is not in the bounce, but in the patience required to wait for the Spring. As the market navigates this complex setup, the winners will be those who refuse to be swayed by the noise and focus instead on the technical realities beneath the surface.
