

XRP, the native digital asset of the XRP Ledger, has recently demonstrated a robust recovery pattern, climbing steadily above the $1.1650 resistance level. Following a broader market trend that saw major assets like Bitcoin and Ethereum regain momentum, XRP has carved out a distinct path of growth. Currently, the asset is undergoing a phase of consolidation, with market participants closely watching the $1.20 psychological barrier as the next critical destination for the bullish trend.
Main Facts: The Current Market State
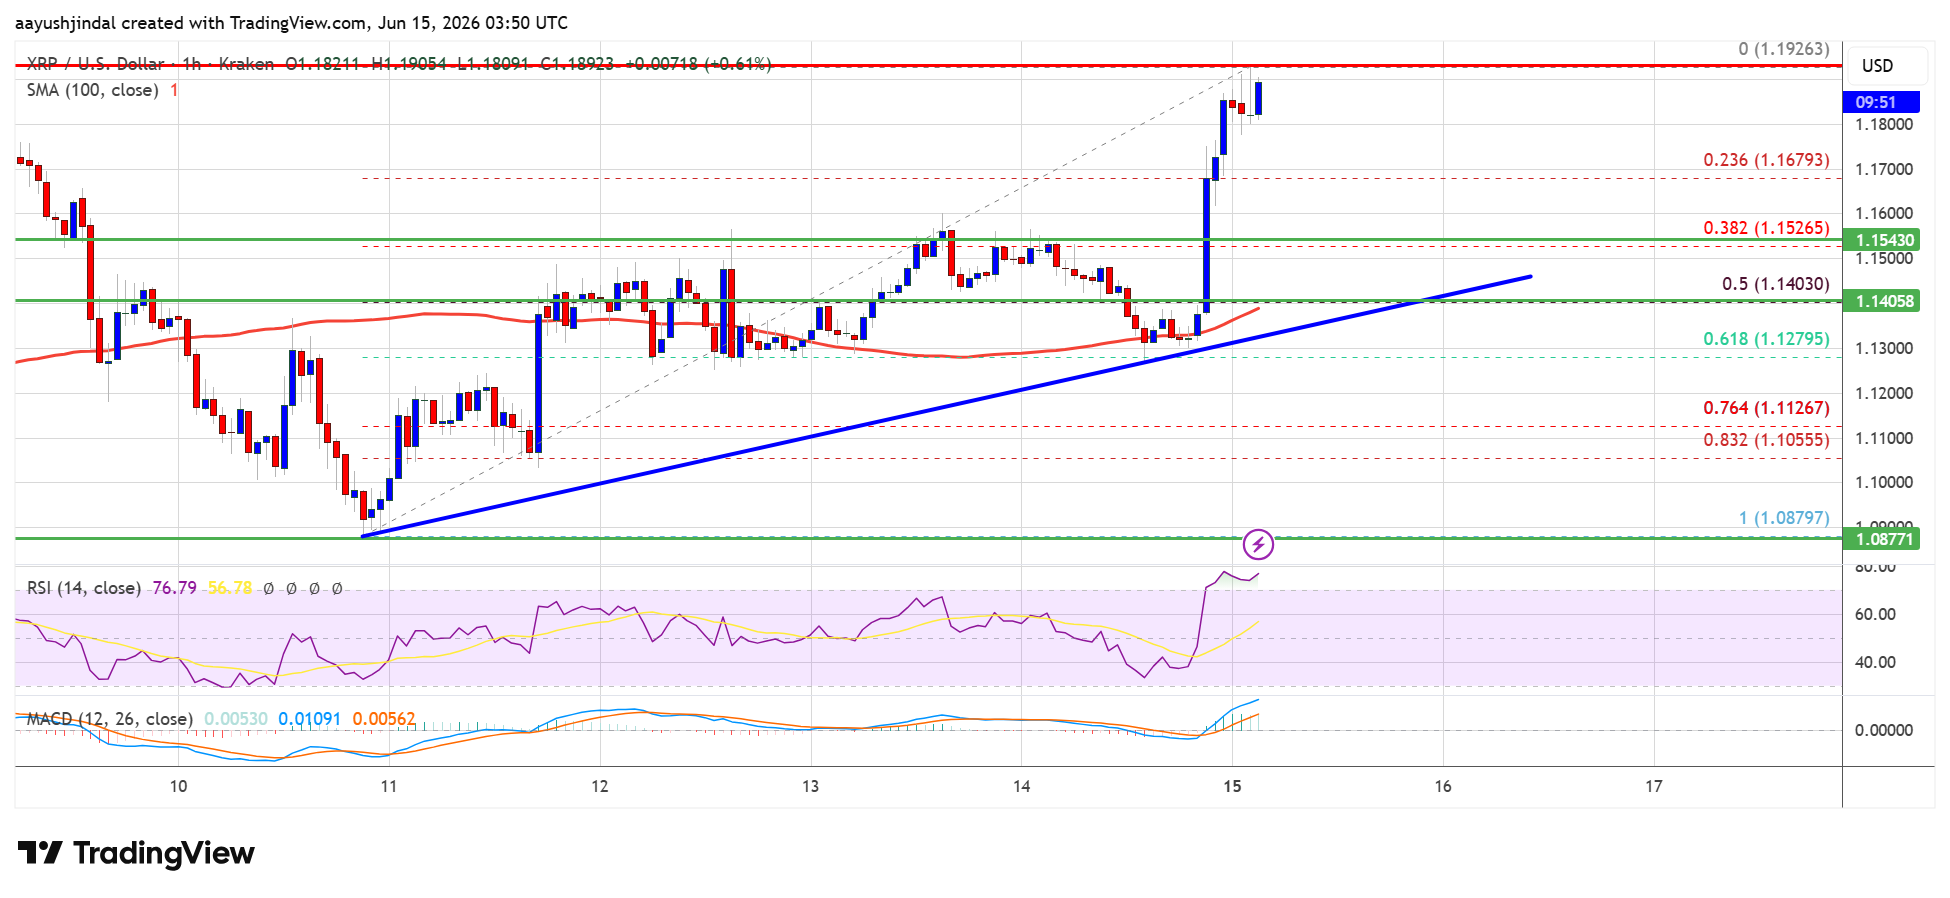
The digital asset market has entered a phase of renewed optimism, and XRP is at the forefront of this recovery. After successfully clearing the $1.1450 and $1.1500 resistance levels, XRP gained the necessary velocity to push past the $1.1680 mark. This movement has been characterized by consistent buying pressure, propelling the price toward an intra-day high of $1.1926.
At the time of writing, XRP is maintaining a position above the $1.180 support zone, effectively staying above the 100-hourly Simple Moving Average (SMA). This positioning is a bullish signal for traders, suggesting that the short-term trend remains firmly in the hands of the buyers. The presence of a clear bullish trend line, supported at $1.140 on the hourly chart, provides a foundational safety net that prevents a rapid collapse in sentiment.
Chronology of Recent Price Action
The recent surge was not an overnight occurrence but rather the result of a deliberate climb that began after a swing low at $1.0879. The recovery can be broken down into three distinct phases:

- The Accumulation Phase: XRP spent considerable time testing the $1.08 to $1.10 range, establishing a base that attracted institutional interest and renewed retail confidence.
- The Breakout: As macroeconomic factors improved and broader crypto market sentiment turned positive, XRP broke through the $1.1450 resistance. This triggered a cascade of buying that pushed the asset through the $1.1680 barrier with relative ease.
- The Consolidation Phase: Following the peak at $1.1926, the market entered a cooling-off period. This is a healthy correction, characterized by the price holding above the 23.6% Fibonacci retracement level of the most recent upward swing. This consolidation is crucial, as it allows the market to digest recent gains before attempting to assault the $1.20 resistance.
Supporting Data and Technical Indicators
Technical analysis paints a constructive picture for XRP, provided the current support levels hold. The indicators currently point to a "Buy" or "Hold" sentiment among short-term traders.
The MACD and RSI Signals
The Hourly Moving Average Convergence Divergence (MACD) for XRP/USD is currently gaining pace within the bullish zone. This indicates that the momentum remains skewed toward the upside. Simultaneously, the Relative Strength Index (RSI) is holding above the 50-level threshold. While not yet in overbought territory—which would typically trigger a sharp pullback—the RSI confirms that buyers are still in control of the market’s trajectory.
Fibonacci Retracement Levels
The Fibonacci retracement levels serve as the roadmap for the current price action. The recent upward move from $1.0879 to $1.1926 provides key markers:
- The 23.6% level: Currently acting as the primary support during the consolidation phase.
- The 50% level: Should a deeper correction occur, the $1.1400 region (coinciding with the trend line) represents the 50% retracement level. This is considered the "make or break" point for the medium-term bullish thesis.
Projected Scenarios: The Path to $1.20 and Beyond
Market analysts are focusing on two primary scenarios for the coming trading sessions.

The Bullish Case: Scaling the $1.20 Wall
Should the bulls maintain their current pressure, the immediate target remains the $1.1920 resistance. A decisive break above this level, followed by a sustained move past the $1.20 psychological barrier, would open the door for a retest of the $1.2150 resistance. If the momentum is sufficient to clear that level, the next targets are projected at $1.2220 and $1.2250, respectively. These levels represent historic resistance zones that could see profit-taking from early-cycle investors.
The Bearish Case: Downside Correction
If the market fails to consolidate above the $1.20 mark, a correction becomes likely. The first level of support sits at $1.1680. A failure to hold this would likely lead to a test of the $1.1550 major support. Should this support also give way, the price could experience a sharper decline toward $1.1400. In an extreme scenario, if the trend line breaks, the market could look toward the $1.1280 or even the $1.1120 support zones. The ultimate "safety" level, which would invalidate the current bullish structure, lies at $1.080.
Market Implications and Strategic Outlook
The behavior of XRP in the current market environment has broader implications for altcoin performance. As a high-liquidity asset with significant utility, XRP often acts as a bellwether for the rest of the crypto market. Its ability to consolidate at higher levels suggests that investors are not merely engaging in "pump-and-dump" behavior but are instead re-evaluating the fundamental value of the token.
For traders, the current environment demands a high degree of discipline. While the trend is upward, the proximity to major resistance levels ($1.20) means that volatility is expected to increase. Risk management, such as setting stop-loss orders just below the $1.1550 support, is recommended to protect capital against sudden market reversals.
Furthermore, as the industry continues to evolve, the role of technical analysis remains paramount. Experts like Aayush Jindal, with over 15 years of experience in the financial trenches, emphasize that while indicators are powerful, they must be viewed through the lens of overall market context. In this current cycle, the interaction between XRP and its 100-hourly SMA will remain the most critical metric for identifying the longevity of this trend.
Conclusion: A Critical Juncture
XRP is currently at a critical juncture. The steady increase from $1.1650 to its recent highs has built a strong foundation, but the journey to $1.20 is fraught with resistance. Whether the asset breaks through or undergoes a deeper correction will likely be determined by the strength of the broader crypto market and the stability of Bitcoin’s price action.
Investors should remain vigilant, monitoring the $1.1680 and $1.1550 support levels as key indicators of the trend’s health. As always, market conditions can change rapidly, and participants are encouraged to conduct their own thorough research and maintain a balanced approach to risk.
Disclaimer: The information provided in this article is for educational and informational purposes only and does not constitute financial, investment, or trading advice. Investing in cryptocurrencies carries significant risk, including the total loss of principal. NewsBTC and its contributors are not responsible for any financial losses incurred based on the information provided herein. Always perform your own due diligence and consult with a qualified financial advisor before making any investment decisions.
