

The cryptocurrency market is currently witnessing a period of pronounced instability, with Ripple’s XRP token finding itself at a critical technical juncture. Following a recent failure to sustain its momentum above the $1.150 resistance zone, XRP has entered a phase of aggressive downside correction. As investors weigh the potential for a deeper retracement against the possibility of a relief rally, the asset’s price action has sparked intense debate among analysts regarding its near-term trajectory.
Main Facts: The Current State of XRP
As of the latest market session, XRP has displayed clear bearish characteristics, struggling to maintain the gains secured earlier in the week. The price action has broken below critical support levels, including the $1.150 and $1.1420 marks, signaling a shift in market sentiment from bullish optimism to cautious risk-aversion.
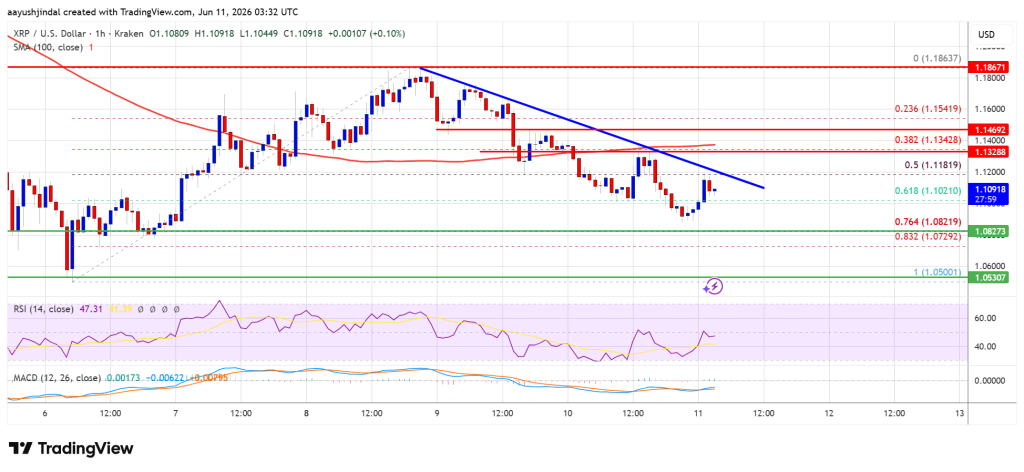
The asset is currently trading below the 100-hour Simple Moving Average (SMA), a technical indicator often used to gauge the medium-term trend. The failure to reclaim this moving average suggests that sellers are currently in control of the market narrative. Furthermore, the hourly chart reveals a persistent bearish trend line, which continues to act as a ceiling for any recovery attempts, currently capping upside momentum at the $1.120 level.
The broader market context exacerbates this pressure. Similar to major market movers like Bitcoin (BTC) and Ethereum (ETH), XRP has succumbed to the prevailing macro-financial headwinds, causing liquidity to shift away from altcoins as traders seek refuge in more stable assets or cash equivalents.

Chronology: The Breakdown of Support
To understand the current volatility, it is essential to analyze the sequence of events that led to the recent breakdown:
- The Peak: XRP reached a localized swing high of approximately $1.1862, following a period of sustained buying pressure that originated from the $1.050 support zone.
- The Initial Slip: As the market approached the $1.1550 threshold, volume began to taper, suggesting a lack of conviction among buyers. The first significant crack occurred when the price dipped below $1.150.
- Fibonacci Retracement: The subsequent slide saw the price traverse below the 50% Fibonacci retracement level, calculated from the move between the $1.050 low and the $1.1862 high. This move effectively invalidated the short-term bullish structure.
- Current Consolidation: Currently, the price is oscillating around the $1.10 support zone. Bulls are making a concerted effort to defend this level, as a breach here would likely trigger a cascade of stop-loss orders, potentially accelerating the decline toward the $1.080 level—the 76.4% Fibonacci retracement mark.
Supporting Data and Technical Indicators
The technical landscape for XRP is currently characterized by a lack of positive momentum, as evidenced by key oscillators:
- MACD (Moving Average Convergence Divergence): The hourly MACD for the XRP/USD pair is currently losing steam within the bearish zone. The convergence of the signal line and the histogram suggests that while the downward momentum may be slowing, there is no immediate evidence of a bullish reversal in the cards.
- RSI (Relative Strength Index): The hourly RSI is languishing below the 50 neutral mark. In technical analysis, an RSI below 50 generally indicates that the selling pressure is outpacing buying interest. Until the RSI can decisively reclaim the 50 level, the path of least resistance remains to the downside.
- Volume Analysis: The volume profile accompanying the decline has been relatively steady, suggesting that the move is not merely a "flash crash" but a structural shift in interest, requiring sustained buying pressure to reverse.
Implications for Investors and Traders
The current price action carries significant implications for market participants. For short-term traders, the $1.1350 level acts as a pivotal resistance. A decisive move above this could invalidate the immediate bearish outlook and open the doors for a retest of the $1.1420 and $1.1550 levels.
Conversely, the downside risk remains significant. Should the bulls fail to hold the $1.080 support level, the market could see a sharp decline toward $1.0650. A failure at this secondary support would likely lead to a test of the $1.050 foundation, and in a worst-case scenario, psychological support at the $1.00 level.

For long-term investors, this correction may be viewed through the lens of historical volatility. The crypto market is notorious for its "wash-out" phases, where weak hands are shaken out before a new trend can emerge. However, the current technical setup emphasizes the need for risk management, as the failure to hold the 76.4% Fib level would suggest that the previous upward momentum has been entirely exhausted.
Expert Perspective: Market Dynamics
Market analysts, including veteran observers like Aayush Jindal, emphasize that the interplay between technology and market psychology is more relevant today than ever. Jindal’s approach, which integrates algorithmic precision with macro-trend analysis, highlights that volatility is not an enemy to be feared but a variable to be managed.
In the context of XRP, the current struggle reflects a broader trend of "wait-and-see" behavior among institutional players. When assets break below key moving averages, automated trading systems often shift to a defensive stance, further suppressing price action. The ability of the market to consolidate near the $1.10 level without a massive spike in selling volume is perhaps the only silver lining for those holding long positions.
Conclusion: A Critical Crossroads
XRP is currently at a defining moment. The transition from a bullish recovery to a bearish correction has left the asset vulnerable to further downside, contingent upon its performance against the $1.080 and $1.10 support levels.
Investors are advised to exercise extreme caution. Technical indicators currently favor the bears, and the lack of a clear bullish catalyst makes a rapid V-shaped recovery unlikely in the immediate term. Market participants should monitor the $1.1350 resistance for any signs of a trend reversal. If the price fails to break this ceiling, the probability of testing the $1.050 support zone increases significantly.
As always, in the volatile world of digital assets, conducting independent research and employing strict risk management protocols—such as setting stop-loss orders and avoiding over-leverage—remains the most effective strategy for navigating these uncertain waters. The coming days will be vital in determining whether XRP can maintain its current floor or if a deeper correction is necessary to reset the market for a more sustainable upward trend.
Disclaimer: The information provided in this article is for educational and informational purposes only. It does not constitute financial, investment, or trading advice. Cryptocurrency investments are subject to high market volatility and risks. Readers are strongly encouraged to perform their own due diligence and consult with a qualified financial advisor before making any investment decisions. The author and the publication assume no liability for any losses incurred as a result of using this information.
