

Executive Summary: XRP’s Recent Market Dynamics
XRP, the native digital asset of the XRP Ledger, has recently demonstrated significant resilience in a volatile cryptocurrency market. Following a period of steady upward momentum that saw the asset break decisively above the $1.1650 resistance level, market participants are now observing a consolidation phase. As the token eyes the critical $1.20 psychological barrier, traders and analysts are closely monitoring technical indicators to determine if this rally is the precursor to a sustained breakout or a temporary plateau before a potential correction.
This analysis provides an in-depth look at the current market structure, the technical indicators guiding price action, and the broader implications for investors as XRP navigates this pivotal resistance zone.
Chronology of the Current Rally
The current upward trajectory for XRP did not occur in a vacuum. It was precipitated by a series of market moves that mirrored broader trends seen in blue-chip assets like Bitcoin and Ethereum.
The Breakout Phase
In recent trading sessions, XRP began to decouple from its previous sideways movement, gaining traction above the $1.1450 and $1.1500 support levels. This surge was characterized by increased buying volume, which allowed the bulls to push the asset through the $1.1680 resistance level—a hurdle that had previously stifled upward movement.
The Peak and Consolidation
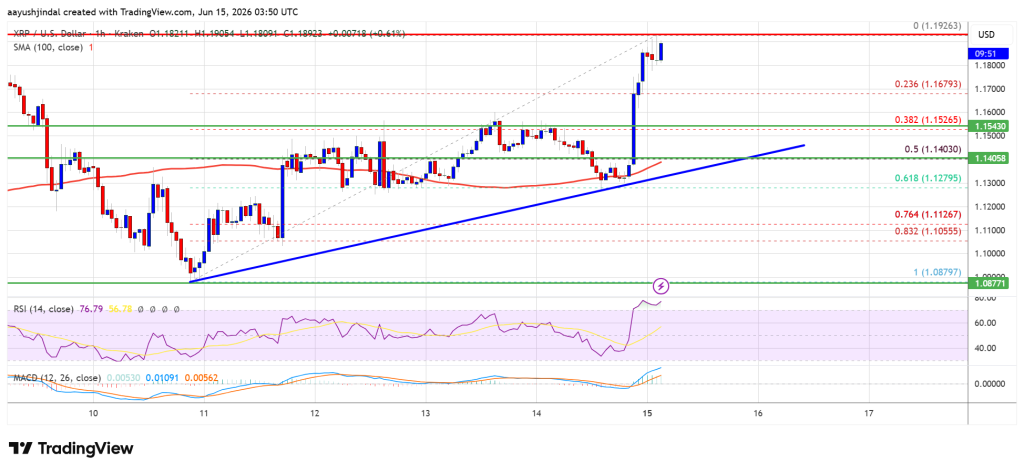
The bullish momentum intensified, propelling the price toward the $1.1880 zone. During this leg, the market recorded a local high at $1.1926. Following this peak, the asset entered a phase of consolidation. Mathematically, this phase is currently holding above the 23.6% Fibonacci retracement level, calculated from the swing low of $1.0879 to the recent high of $1.1926. This consolidation is a healthy sign for market technicians, as it suggests that the asset is building a "base" from which to launch a potential secondary assault on higher resistance levels.

Supporting Data and Technical Indicators
To understand the likelihood of a breakout, one must examine the underlying mechanics of the XRP/USD pair. As of the latest market data, the asset is trading consistently above $1.180, comfortably positioned above its 100-hourly Simple Moving Average (SMA).
Trendline Analysis
A pivotal bullish trendline has formed on the hourly chart, providing a structural floor near the $1.1400 level. This trendline acts as the first line of defense for the bulls, and as long as the price maintains its position above this line, the technical outlook remains cautiously optimistic.
Key Technical Indicators
- Hourly MACD (Moving Average Convergence Divergence): The MACD line for XRP/USD is currently gaining momentum within the bullish zone. This indicates that the buying pressure is not yet exhausted and that the underlying trend remains positive.
- Hourly RSI (Relative Strength Index): The RSI is currently hovering above the 50-level threshold. While not yet in overbought territory (typically above 70), its position above the mid-line signifies that buyers remain in control of the short-term narrative.
Implications: The Battle for $1.20
The path ahead for XRP is fraught with significant resistance levels that the market must overcome to confirm a bullish continuation.
The Road to $1.20 and Beyond
If the current momentum continues, the immediate hurdle lies at the $1.1920 level. However, the true test remains at the $1.2000 psychological barrier. A definitive, high-volume break above this level would likely shift market sentiment, potentially opening the door for a move toward $1.2150. If the bulls maintain their current pace, targets could extend to $1.2220, with a major long-term hurdle located at $1.2250.
The Risk of Downside Correction
Conversely, failure to clear the $1.20 zone could trigger a reversal. In such a scenario, initial support is found at $1.1680. Should this level fail, the next critical support zone is $1.1550. A close below $1.1550 would be a bearish signal, likely accelerating a decline toward the $1.1400 trendline and potentially testing the 50% Fibonacci retracement level of the recent move. Should selling pressure intensify further, the primary support rests at $1.0800, a level that would represent a significant structural breakdown for the current bullish thesis.

Expert Perspective: Analyzing Market Volatility
Aayush Jindal, a senior market analyst with over 15 years of experience in the Forex and cryptocurrency sectors, notes that the current environment for XRP is representative of a classic "retest and consolidate" pattern.
"The ability for an asset to hold its gains after a rapid run-up is often more telling than the run-up itself," Jindal notes. "By consolidating above the 100-hourly SMA, XRP is showing that there is institutional or retail interest in defending these higher price levels. However, in the crypto markets, the ‘psychological’ resistance of a round number like $1.20 often acts as a self-fulfilling prophecy, leading to increased sell-orders as traders look to lock in profits."
Jindal emphasizes that while technical analysis provides a map for the road ahead, the reality of digital assets is dictated by broader macroeconomic flows. As a developer and trader, he suggests that investors should not just watch the candles on a chart, but also monitor the flow of liquidity into the broader altcoin market, as XRP often acts as a bellwether for non-Bitcoin assets.
Market Sentiment and Investor Strategy
The current sentiment surrounding XRP remains "cautiously bullish." The asset has successfully navigated through a period of high uncertainty to establish a new support floor. For long-term investors, the focus remains on whether the current consolidation holds. For short-term traders, the focus is squarely on the interaction between the $1.1920 resistance and the $1.2000 target.
Strategic Considerations
- Risk Management: Given the volatility inherent in the crypto market, stop-loss orders placed just below the $1.1400 trendline could mitigate potential losses if the momentum shifts downward.
- The Role of Volume: Any breakout above $1.20 should be supported by a surge in trading volume. A "breakout" on low volume is often considered a "fakeout" by experienced traders.
- Macroeconomic Correlation: XRP’s correlation with the broader market should not be ignored. If Bitcoin experiences a sudden pullback, even the most bullish XRP technical setup may fail to hold.
Conclusion
XRP is currently at a crucial juncture in its price action. The transition from $1.1650 to its current range indicates a robust level of support that has been hard-won. As the market looks toward the $1.20 resistance level, the combination of a positive MACD and a supportive trendline suggests that the bulls still have the advantage.
However, as is the nature of financial markets, the higher the price, the more intense the selling pressure becomes from those looking to realize gains. Investors should maintain a disciplined approach, keeping a close eye on the $1.1680 support level as the ultimate litmus test for the short-term trend. Whether the asset breaks through to new highs or retreats to re-test lower support, the coming days will be vital in determining the medium-term direction for XRP.
Disclaimer: The information provided in this article is for educational and informational purposes only. It does not constitute financial, investment, or trading advice. Cryptocurrency investments are subject to high market volatility and risk. Always conduct your own research (DYOR) and consult with a qualified financial advisor before making any investment decisions. The author and the publisher assume no responsibility for any financial losses incurred based on the information provided herein.
