

The cryptocurrency market is currently witnessing a period of heightened sensitivity, with Solana (SOL) finding itself at a critical technical juncture. Following a failed attempt to maintain a position above the $67 threshold, the asset has entered a corrective phase, mirroring the broader market instability observed in major digital assets like Bitcoin and Ethereum. As investors closely monitor price action, the question remains whether Solana can establish a firm floor or if it is poised for a deeper retracement.
Main Facts: The Current Market Landscape
Solana’s recent price action has shifted from a period of bullish momentum to a defensive consolidation phase. Having retreated from a recent swing high of $67.90, the asset has slipped below the pivotal $65 level. This decline represents more than a mere fluctuation; it indicates a shift in market sentiment as traders reassess their positions in light of shifting macroeconomic factors and technical resistance.
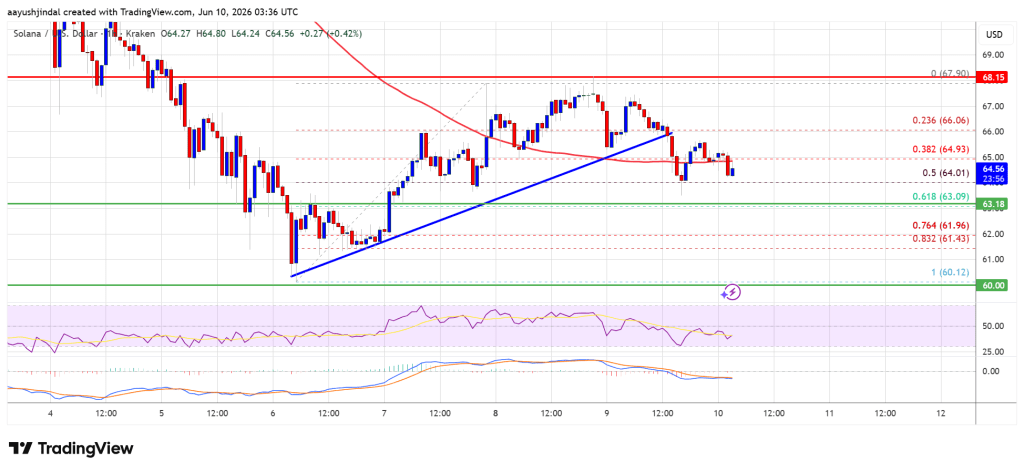
Currently, SOL is trading beneath its 100-hour simple moving average, a common indicator that short-term momentum has transitioned into the hands of the bears. The failure to sustain the $67 support level has effectively invalidated the immediate bullish trend line, forcing market participants to recalibrate their expectations. While the asset has managed to test the $63.20 support level, the current trajectory suggests that the market is struggling to find a catalyst to reverse the bearish trend in the immediate term.
Chronology of the Downturn
The recent price movement can be mapped through a series of key technical events:

- The Rejection: The upward wave, which saw SOL climb from a swing low of $60.12 to a peak of $67.90, hit a wall of selling pressure. The inability to consolidate above $67 signaled exhaustion among buyers.
- The Breakdown: Following the rejection, the SOL/USD pair experienced a sharp decline, breaking below the 50% Fibonacci retracement level. Simultaneously, a critical bullish trend line support on the hourly chart, situated at $66, was breached.
- Testing Support: As momentum shifted, the price descended rapidly, testing the $63.20 support zone. This level currently acts as the primary barrier preventing further decline.
- Current State: As of the latest market data, Solana is oscillating below $65, facing stiff resistance as it attempts to reclaim the ground lost during the recent sell-off.
Supporting Data and Technical Analysis
To understand the depth of this correction, one must look at the quantitative indicators currently influencing trader behavior.
Fibonacci Retracement Analysis
The price action is currently hovering near the 61.8% Fibonacci retracement level of the move from $60.12 to $67.90. This level is historically significant; a failure to hold this zone often acts as a precursor to a retest of the initial swing low. If the $62.20 support level—a key structural floor—is compromised, the technical outlook suggests that the asset could quickly migrate toward the $60 psychological support zone.
Momentum Oscillators
Technical indicators corroborate the bearish narrative:
- MACD (Moving Average Convergence Divergence): The hourly MACD for the SOL/USD pair is currently gaining pace within the bearish zone, indicating that selling pressure is strengthening rather than dissipating.
- RSI (Relative Strength Index): The RSI is currently situated below the 50-level, confirming that the bears are currently in control of the trend. Until the RSI can reclaim the 50-level, a sustained recovery remains unlikely.
Critical Resistance Zones
For the bulls to reclaim control, the following hurdles must be overcome:

- $65.00: The immediate hurdle. A successful flip of this level into support is required to initiate any meaningful recovery.
- $66.00: The former support level that now acts as a technical ceiling.
- $67.20: A major resistance zone. A daily close above this level would negate the current bearish outlook and potentially pave the way for a run toward $68 and $70.
Market Implications and Strategic Outlook
The current volatility in Solana is reflective of a wider trend in the altcoin market, where high-beta assets often suffer disproportionately when top-tier assets like Bitcoin experience even moderate pullbacks. The implications for investors are twofold.
Firstly, the "wait-and-see" approach has become the dominant strategy. Institutional and retail traders alike are waiting for a clear sign of volume-backed recovery. A close below the $60 support level would be a significant technical breakdown, potentially triggering a cascade of sell orders that could drive the price toward the $55 support level in the medium term.
Secondly, the utility of Solana remains a primary driver for its long-term value proposition. Despite short-term price fluctuations, the network’s throughput, low transaction costs, and growing ecosystem of decentralized applications (dApps) provide a fundamental cushion that traders often weigh against technical chart patterns. However, in the short term, technical factors appear to be overriding fundamental sentiment.
The Expert Perspective: Navigating Volatility
Market veterans emphasize that in periods of high volatility, risk management is the only reliable tool for capital preservation. The current setup for Solana suggests a "range-bound" environment where the asset is trapped between liquidity pockets. Traders are advised to monitor the $62.20 level closely; a breakdown here without a rapid recovery could signal a change in the market structure from a corrective phase to a full-blown downtrend.
Conversely, for those looking for accumulation opportunities, the area between $60 and $62 represents a high-interest zone. However, the requirement for a stop-loss strategy is paramount, given the current bearish alignment of the MACD and RSI indicators.
Conclusion
Solana finds itself at a crossroads. The technical indicators are currently aligned in favor of the bears, with the asset struggling to reclaim the $65 level. While the $63.10 and $62.50 support levels are providing a temporary buffer, the market is fragile. Investors should remain cautious, focusing on the $67.20 resistance as the ultimate litmus test for a bullish reversal. Until the broader crypto market stabilizes and SOL can show sustained buying volume above its moving averages, the outlook remains cautiously bearish, with a focus on protecting capital against potential downside volatility.
Disclaimer: The information provided in this article is for educational purposes only and does not constitute financial, investment, or trading advice. Cryptocurrency investments are subject to high market volatility and risk. You are strongly advised to conduct your own research and consult with a professional financial advisor before making any investment decisions. NewsBTC and its contributors assume no responsibility for any losses incurred as a result of using this information.
