

The cryptocurrency market is currently witnessing a period of intense focus on Ripple’s XRP. Following a period of consolidation, XRP has begun to exhibit renewed bullish momentum, effectively decoupling from some of its lateral movements to challenge critical resistance zones. As the asset trades above the $1.180 threshold, market participants are closely monitoring whether the current upward trajectory will provide the necessary volume to break past the psychological $1.20 barrier or if a period of profit-taking will lead to a corrective phase.
Main Facts: The Current Market State
XRP has demonstrated a robust recovery pattern, recently surging past the $1.1650 resistance level. This movement mirrors broader market trends seen in major assets like Bitcoin and Ethereum, suggesting a high correlation with the wider crypto-market sentiment.
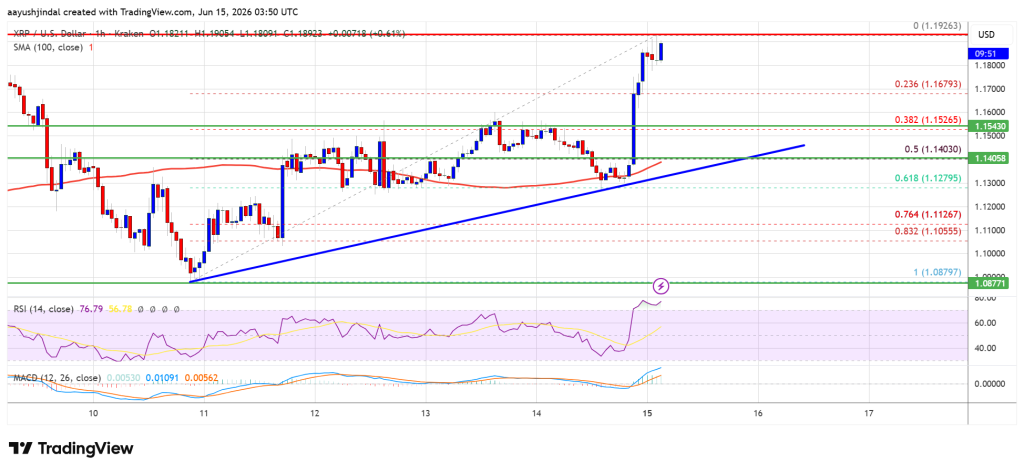
The asset’s price action is currently defined by a clear upward move that cleared the $1.1680 resistance zone with relative ease. Bulls successfully pushed the price to a local high of $1.1926, establishing a strong base above the 100-hourly Simple Moving Average (SMA). This structural improvement has placed XRP in a favorable position for potential further gains, provided the buying pressure remains consistent.
Chronology: The Path to $1.19
The recent rally began after the price successfully broke through the $1.1450 and $1.150 resistance levels. This breakout served as the catalyst for the subsequent climb.

- The Initial Breakout: After establishing a swing low at $1.0879, the bulls initiated a steady climb, overcoming the $1.1680 barrier.
- Consolidation: Upon hitting the $1.1926 high, the asset entered a consolidation phase. This phase is technically significant as the price held above the 23.6% Fibonacci retracement level of the move from the $1.0879 low to the $1.1926 high.
- Current Stance: As of the latest market data, the asset is trading comfortably above $1.180, bolstered by an ascending trend line on the hourly charts that provides support near $1.140.
Supporting Data: Technical Indicators and Momentum
To understand the sustainability of this rally, one must look at the underlying technical indicators.
- MACD (Moving Average Convergence Divergence): The hourly MACD for the XRP/USD pair is currently gaining momentum within the bullish zone, suggesting that the buying interest is not yet exhausted.
- Relative Strength Index (RSI): The RSI is currently hovering above the 50 level, indicating that the market is in a healthy, bullish territory without being immediately overbought, which provides room for further upside.
- Moving Averages: The price’s position above the 100-hourly SMA is a classic indicator of a short-term uptrend. As long as the price maintains this position, the technical outlook remains cautiously optimistic.
The Bulls’ Path: Targeting $1.20 and Beyond
For the bulls to maintain control, a decisive breakout above the $1.1920 and $1.1950 resistance levels is required. Should the market witness a sustained move above $1.20, the technical outlook shifts significantly.
The next major resistance targets are set at $1.2150 and $1.2220. If these levels are conquered, the $1.2250 level stands as the primary hurdle for the medium term. Traders are watching the order books closely, as a breach of the $1.20 level could trigger a wave of FOMO (Fear Of Missing Out) buying, potentially accelerating the move toward higher targets.
The Bearish Scenario: Potential for Downside Correction
Conversely, if the market fails to clear the $1.20 resistance, a reversal is plausible. In such an event, the first line of defense for the bulls is the $1.1680 support level. A breakdown below this could test the $1.1550 zone.

If the selling pressure forces a close below $1.1550, the price is likely to revisit the $1.1400 support, which aligns with the critical trend line and the 50% Fibonacci retracement level. A further descent could see the price testing the $1.1280 and $1.1120 levels, with the ultimate support floor established at $1.080.
Implications for Investors and the Broader Ecosystem
The current price action of XRP is not merely a technical movement; it reflects the broader sentiment regarding Ripple’s role in the global financial landscape. When XRP shows strength, it often signals an influx of liquidity into the altcoin market.
Investors should consider the following implications:
- Volatility Management: With the price hovering near major resistance, volatility is expected to increase. Traders are advised to utilize stop-loss orders to protect capital against sudden trend reversals.
- Macro Correlation: While XRP is showing independent strength, its movement remains tethered to the performance of Bitcoin. Any sudden shift in the macro-economic environment or BTC volatility will inevitably impact XRP’s ability to sustain its current level.
- Strategic Positioning: For long-term holders, the current consolidation is seen as a necessary phase to build a base for higher rallies. However, for short-term day traders, the $1.20 resistance serves as a "make-or-break" point for entries.
Market Analysis: Expert Perspective
Market experts point out that the recent stability in XRP, even during minor corrections, demonstrates a maturing market. Unlike past cycles where XRP would exhibit extreme volatility, the current consolidation above the 100-hourly SMA suggests that institutional or more sophisticated retail participants are accumulating at these levels.
The role of technical analysis in these scenarios is to provide a framework for decision-making. As outlined by senior market experts, identifying key support and resistance levels is the primary defense against emotional trading. In the current environment, the focus remains on the interplay between the $1.1680 support and the $1.20 resistance.
Conclusion: Watching the $1.20 Trigger
The road ahead for XRP is paved with technical challenges. The asset is at a pivotal junction where the decision of the broader market will determine its direction for the coming sessions. If the bulls can maintain the current trend line and break through the $1.20 threshold, the path to $1.25 and beyond may become clearer.
However, in the volatile world of cryptocurrency, nothing is guaranteed. Investors are encouraged to monitor the hourly RSI and MACD for signs of divergence, which could indicate a weakening of the current trend. As always, rigorous risk management and a clear understanding of personal investment horizons remain the best tools for navigating these markets.
Disclaimer: This report is for educational purposes only and does not constitute financial advice. The information provided is based on market analysis and should not be interpreted as a recommendation to buy or sell any assets. Cryptocurrency investments carry inherent risks, and readers are advised to conduct their own independent research before making any financial decisions.
