
The digital asset market is notoriously cyclical, characterized by periods of intense volatility followed by deep consolidation. Within this landscape, XRP—the token closely associated with Ripple Labs—has long been one of the most closely watched and highly debated cryptocurrencies.
According to a comprehensive technical analysis published on TradingView by prominent market analyst The_AlchemistTrader, XRP is currently resting at a critical structural junction. The analysis highlights a confluence of multiple technical indicators, suggesting that the asset is positioning itself for its next major macro move.
This deep dive explores the technical foundations of XRP’s current price action, the history of its market structure, the mechanics of harmonic trading patterns, and the potential implications for the broader digital asset market.
Main Facts: The Structural Junction of XRP
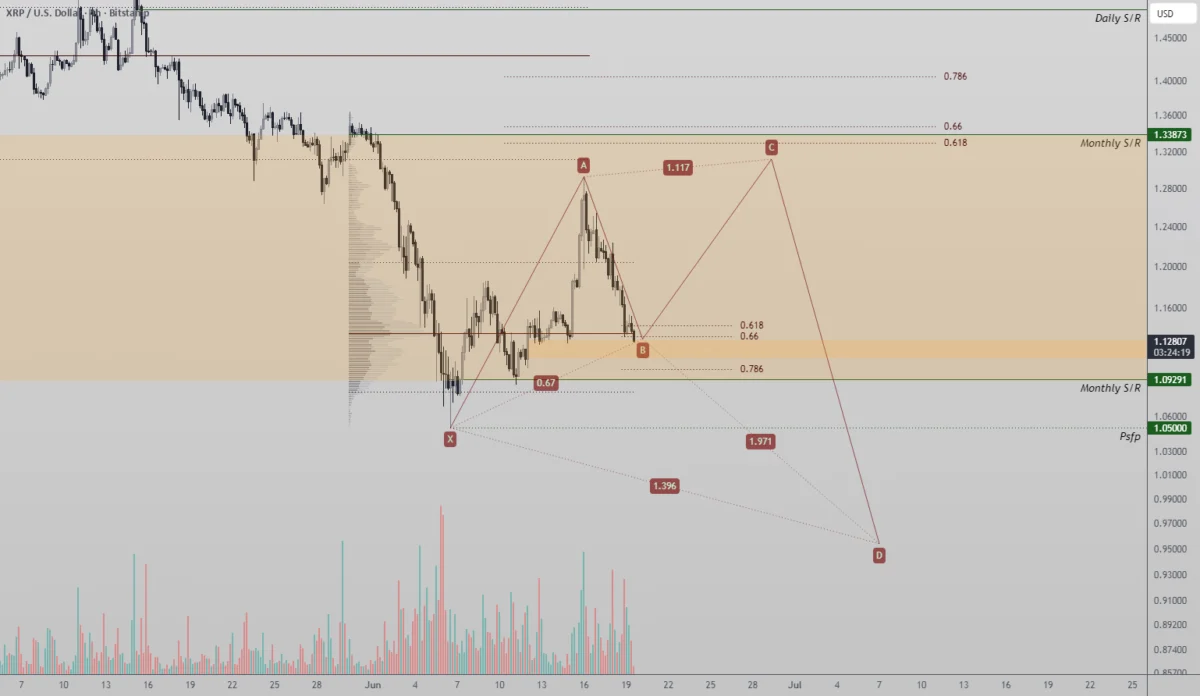
The core of the technical thesis presented by The_AlchemistTrader centers on a highly defined "confluence zone" on the XRP/USD daily and weekly charts. In technical analysis, confluence refers to a scenario where multiple independent analytical tools—such as Fibonacci levels, volume profiles, and chart patterns—point to the exact same price level as a major area of support or resistance.
For XRP, this confluence zone is bolstered by three primary pillars:
- The 0.618 Fibonacci Retracement Level: Widely regarded by technical analysts as the "Golden Ratio," this level represents a critical pullback threshold. In healthy uptrends, assets frequently correct back to the 0.618 level before resuming their primary upward trajectory.
- The Point of Control (POC): Derived from the Volume Profile Visible Range (VPVR), the POC is the specific price point where the highest volume of trading activity has occurred over a given period. It acts as a powerful financial magnet, representing "fair value" where buyers and sellers have historically found equilibrium.
- A Large-Scale Harmonic Reversal Pattern: Harmonic price patterns use geometric structures and Fibonacci ratios to identify potential turning points in the market. The analyst notes that XRP is currently carving out the final stages of a macro harmonic pattern, which could signal the transition from a multi-month correction to a new bullish expansion phase.
The interaction between these three elements creates a formidable battleground. If buyers can successfully defend this zone, it could lay the groundwork for a structural trend reversal. Conversely, a failure to hold this support could invalidate the bullish thesis and lead to a deeper correction.
Chronology: XRP’s Path to the Critical Support Zone
To understand the significance of the current technical setup, it is necessary to trace the path of XRP’s price action over the preceding market cycles. XRP’s historical price movement is unique compared to other major cryptocurrencies, largely due to its prolonged regulatory battle with the U.S. Securities and Exchange Commission (SEC), which began in December 2020.
[Dec 2020: SEC Lawsuit Filed]
       │
       ▼
[2021 Bull Run: XRP underperforms macro highs due to exchange delistings]
       │
       ▼
[July 2023: Summary Judgment (Programmatic sales ruled not investment contracts)]
       │
       ▼
[Post-Ruling: Volatility spike to ~$0.93 followed by long-term bleeding]
       │
       ▼
[Mid-2024: Compression into the 0.618 Fibonacci & Point of Control (POC) Zone]
The 2021-2022 Cycle: Underperformance and Compression
While Bitcoin and Ethereum surged to new all-time highs in 2021, XRP was heavily constrained by the SEC litigation. Many major U.S. cryptocurrency exchanges delisted or suspended trading for the token, severely restricting liquidity and depressing retail demand. Despite these headwinds, XRP managed a rally to approximately $1.96 in April 2021, though it fell short of its 2018 all-time high of $3.84.
Following the 2021 peak, XRP entered a prolonged multi-year downtrend and consolidation phase, establishing a broad trading range between $0.30 and $0.90.
The July 2023 Judicial Breakthrough and Subsequent Sell-Off
On July 13, 2023, District Judge Analisa Torres issued a landmark summary judgment, ruling that XRP sold to retail investors on public exchanges did not constitute investment contracts. The news triggered an immediate 100% price surge, driving XRP from roughly $0.47 to a peak of $0.93 in a matter of hours.
However, the rally lacked sustainable buying volume. Over the subsequent months, the initial excitement faded, and XRP slowly bled value, retracing the entirety of its post-ruling gains. This slow bleed gradually pushed the asset back down into the long-term consolidation range, eventually landing it at the critical support levels identified in the current June technical analysis.
Supporting Data: Deconstructing the Technical Confluence
The bullish reversal thesis is not built on speculation but on quantifiable technical metrics. Understanding these metrics reveals why market participants are watching this specific price zone closely.
The Golden Ratio: The 0.618 Fibonacci Retracement
The Fibonacci retracement tool is based on the mathematical sequence discovered by Leonardo Fibonacci. In financial markets, these ratios are used to identify potential support and resistance levels.
  High (Peak of the Move) ─── 1.000
   │
   ├── 0.382 Retracement
   │
   ├── 0.500 Retracement
   │
   ├── 0.618 Retracement (The Golden Ratio / Key Support Zone)
   │
  Low (Origin of the Move) ── 0.000
When an asset undergoes a correction after a major impulse move, the 0.618 level represents the ultimate threshold for a healthy pullback.
- If the price bounces cleanly off the 0.618 level, it indicates that the underlying uptrend remains intact and that buyers are stepping in at a mathematically logical discount.
- If the price closes decisively below the 0.618 level, it often signals a structural breakdown, turning the former support into a formidable overhead resistance level.
Volume Profile Visible Range (VPVR) and the Point of Control (POC)
Unlike traditional volume indicators that display volume relative to time (at the bottom of a chart), the Volume Profile displays volume relative to price (horizontal bars on the side of the chart). This tool highlights the price levels where the most significant market activity has taken place.

The Point of Control (POC) is the single highest horizontal volume bar within the selected range.
- Because a vast number of transactions occurred at this price in the past, the POC acts as a zone of high liquidity.
- When the price approaches the POC from above, it typically acts as strong support because historical buyers are highly motivated to defend their average entry positions, and institutional players view it as an area of high liquidity where they can fill large orders without causing excessive slippage.
The Harmonic Reversal Framework
Harmonic trading relies on highly specific geometric chart patterns that utilize precise Fibonacci retracement and extension ratios. Common harmonic patterns include the Gartley, Bat, Butterfly, and Crab patterns.
        X (Origin)
       /
      /
     /        C
    /        /
   /         B
  /
 A
                    D (Potential Reversal Zone - PRZ)
These patterns assume that financial markets, like many natural phenomena, move in geometric cycles. The_AlchemistTrader indicates that XRP is completing the "D" wave (the final leg) of a macro harmonic pattern. The terminal point of this wave lies directly within the confluence of the 0.618 Fibonacci level and the POC. This intersection is known as the Potential Reversal Zone (PRZ). When multiple technical systems align at a single price point, the probability of a sharp trend reversal increases.
Market Sentiment and Fundamental Catalysts
Technical analysis does not exist in a vacuum. To fully understand XRP’s potential path forward, the chart analysis must be weighed against prevailing market sentiment and external fundamental drivers.
The Regulatory Landscape and Ripple’s Legal Standing
While the July 2023 ruling provided substantial legal clarity, the legal battle between Ripple and the SEC has continued to loom over the asset. The transition of the lawsuit into its remedies phase—where the court determines the final penalties and injunctions regarding Ripple’s institutional sales—has created a persistent state of uncertainty.
Many institutional investors have remained on the sidelines, waiting for a final, unappealable resolution before committing significant capital to the XRP ecosystem. Any official legal updates or settlement announcements are likely to act as major catalysts, either validating the technical reversal or invalidating the support zone entirely.
Broader Crypto Market Dynamics and Liquidity Cycles
The performance of altcoins like XRP is heavily correlated with the broader cryptocurrency market, which is dominated by Bitcoin (BTC) and Ethereum (ETH).
- Bitcoin Dominance: Historically, when Bitcoin dominance is high and rising, altcoins struggle to maintain upward momentum, often bleeding value against BTC even if they remain stable against the USD.
- Global Liquidity: The broader macroeconomic environment, characterized by central bank interest rate policies and global liquidity cycles, plays a massive role in risk-on asset classes. A return to expansionary monetary policies generally favors speculative assets, providing the necessary capital inflows to trigger technical reversals in lagging altcoins like XRP.
Future Implications and Potential Scenarios
As XRP sits at this critical technical juncture, market participants are preparing for two primary outcomes. The price action in the coming weeks will determine which macro scenario plays out.
                           ┌──► Bullish: Reclaim resistance, high volume ──► Target: $0.90+
                           │
[XRP at Confluence Zone] ──┤
                           │
                           └──► Bearish: Break support, low volume bounce ──► Target: <$0.30
The Bullish Path: Validation, Volume, and Targets
For the harmonic reversal thesis to be validated, XRP bulls must deliver a decisive response. A simple temporary bounce or "liquidity sweep" (where the price briefly dips below support to trigger stop-losses before recovering) is not enough.
- Volume Confirmation: A valid reversal must be accompanied by an expansion in buying volume. This indicates institutional accumulation rather than mere retail speculation.
- Reclaiming Key Resistance: Bulls must quickly push the price above immediate short-term resistance levels, transforming them into support.
- Target Horizons: If the harmonic pattern plays out successfully, the standard target for a harmonic reversal is the 0.382 and 0.618 Fibonacci extension levels of the entire downward move. This would place initial targets in the $0.75 to $0.90 range, with the potential for a larger breakout if macroeconomic conditions align.
The Bearish Path: Breakdown, Invalidation, and Downside Risk
If the confluence zone fails to hold, the consequences for XRP’s market structure could be severe.
- Loss of the 0.618 Support: A daily or weekly close below the confluence zone would invalidate the harmonic reversal pattern.
- The POC Transition: If the price falls below the Point of Control, this high-volume node will transition from a strong floor of support into a massive ceiling of overhead resistance. Any future relief rallies would likely be capped at this level.
- Downside Targets: A breakdown below this support zone would open the door for a retest of the lower boundary of XRP’s multi-year range, potentially targeting the $0.35 to $0.30 liquidity pools.
Impact on the Wider Altcoin Market
XRP has historically served as a sentiment bellwether for the altcoin market. Because of its unique regulatory profile, a major technical breakdown or breakout for XRP often reverberates through other high-cap altcoins.
A successful defense of this critical support zone and a subsequent macro reversal would likely boost risk-on sentiment across the altcoin space, potentially signaling the start of a broader "altseason." Conversely, a failure to hold this key level could signal continued dominance for Bitcoin and a prolonged consolidation phase for the rest of the digital asset market.
Conclusion: A Definitive Battleground for Bulls and Bears
The technical setup identified by The_AlchemistTrader highlights a defining moment for XRP. The alignment of the 0.618 Fibonacci retracement, the high-volume Point of Control, and a macro harmonic reversal pattern makes this one of the most significant technical junctions on the XRP chart in recent history.
As is always the case in financial markets, technical setups are maps of probability, not certainty. The market now faces a clear choice: either the bulls step in to defend this heavily traded value zone and initiate a long-awaited structural reversal, or the bears break through the defenses, forcing a deeper re-evaluation of XRP’s long-term market structure. Traders and investors alike will be watching the daily and weekly candle closes with intense scrutiny to see which side wins this high-stakes battle.
