
XRP, the native digital asset of the XRP Ledger, currently finds itself at a critical technical juncture. Following a period of aggressive selling pressure that saw the asset retreat from its yearly highs, market participants are now closely monitoring whether the current price action represents a mere relief bounce or the inception of a significant structural recovery. As the asset hovers near the $1.10 support zone, technical analysts are pointing to a potential three-part impulse wave that could propel XRP toward the $3.00 threshold, provided buyers can overcome the significant overhead resistance that formed during the recent market crash.
The Chronology of a Correction: From W-X-Y to Potential Impulse
To understand the current state of XRP, one must examine the macro-corrective sequence that has defined its price action over the past several months. Market observers, including the prominent analyst RWA_Investor, have mapped out a "W-X-Y" double zigzag correction that has effectively consumed a substantial portion of the asset’s recent history.
The Foundation: The Wave W Decline
The sequence began with a classic ABC decline, which culminated in a major low labeled as (C)/(W) in early February. This period marked a capitulation phase for many retail holders, setting the stage for a period of consolidation.
The Interlude: The Linking Wave X
Following the February lows, XRP experienced a corrective rally—a linking "Wave X"—which saw the price climb above the $1.50 level by mid-May. This movement was characterized by an internal (X)-(A)-(B) sequence, suggesting that while momentum was building, the market lacked the structural strength to maintain the breakout. The subsequent rollover from these highs initiated the final "Y" leg of the sequence.
The Current State: Testing the $1.10 Floor
The "Y" leg has brought the XRP price back down to the $1.12 range at the time of writing. This area is widely considered the "make or break" zone. For the bulls, this represents the launchpad for a new, primary trend. For the bears, a failure to hold this support could invite a deeper retest of lower macro levels.
Technical Analysis: Mapping the Path to $3.00
The current technical setup suggests that XRP is transitioning from a corrective phase into a bullish impulse wave—a structural change that, if confirmed, would fundamentally alter the market’s medium-term trajectory.
The Three-Wave Recovery Strategy
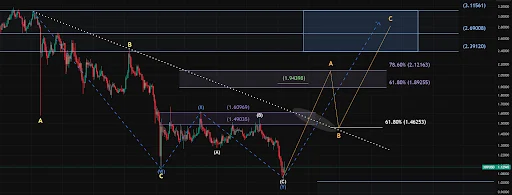
The projected recovery is mapped out as an ABC sequence, with a final target destination box situated between $2.39 and $3.11.
- Wave A (The Initial Push): Analysts expect the first leg of this recovery to test the $2.12 resistance level. This will not be a seamless ascent, as the asset must first clear the $1.46 support/resistance trendline. The $1.46 level serves as a primary psychological hurdle; breaking through it would confirm that the buying interest is sufficient to overcome the sellers who entered the market during the May rollover.
- Wave B (The Strategic Pullback): Following the move to $2.12, the model anticipates a retracement back toward $1.46. It is crucial for investors to view this as a healthy consolidation rather than a return to bearish sentiment. In technical terms, this "shakeout" serves to flush out weak hands and establish a higher base for the final leg.
- Wave C (The Final Advance): The third and final leg of the sequence is projected to be the most aggressive, targeting the $2.70 to $3.11 range. This move would signify a shift in market psychology, potentially signaling that the macro bottom established near $1.05 is the foundation for a run at all-time highs.
Supporting Data and Market Sentiment
The technical outlook is supported by a confluence of data points, though analysts remain cautious regarding the broader macroeconomic climate.
Trading Interest and Liquidity
Recent data indicates a surge in trading interest surrounding XRP. High-volume activity at current levels suggests that institutional and retail investors alike are closely watching the $1.10 pivot. Increased volume during a period of price stabilization is typically interpreted as a sign of "accumulation," where smart money slowly absorbs the supply before a potential breakout.

The "Macro Bottom" Argument
Should XRP manage to clear the $3.10 barrier, it would provide strong evidence that the macro bottom is firmly behind us. In this scenario, the three-part impulse structure would be viewed by market historians as the beginning of a structural reversal. However, analysts are quick to note that technical patterns are reactive, not predictive. The failure to clear the $3.10 zone could lead to a loss of momentum, potentially triggering a decline toward the $0.75–$1.00 range.
Several independent analysts have echoed this sentiment, noting that the $0.87 to $0.92 region remains a key area of interest for "buy-the-dip" strategies if the current impulse fails to materialize.
Official Responses and Regulatory Context
While the price action is governed by supply and demand, the broader context of XRP remains intertwined with the regulatory environment. While official representatives of Ripple have largely avoided commenting on short-term price movements, their public statements regarding the expansion of the XRP Ledger (XRPL) and the growth of the Ripple payments network provide a backdrop for the asset’s utility.
In recent industry forums, Ripple leadership has emphasized that the focus remains on the integration of stablecoins on the XRPL and the expansion of cross-border payment corridors. For the market, these developments serve as a "fundamental floor." When technical charts reach a point of indecision, investors often look to these fundamental milestones—such as the increased adoption of the XRPL—to justify holding positions through periods of high volatility.
Implications: Navigating the Coming Weeks
The implications for the next several weeks are significant. If the bullish impulse holds, XRP could quickly reclaim its status as a top-tier market performer, potentially decoupling from the wider market sentiment if specific utility-driven catalysts emerge.
However, the "three-part impulse" thesis carries inherent risks:
- Resistance Overhang: The price levels that broke during the May crash are now heavy with "bag holders"—investors who bought at higher prices and are looking to exit at break-even. This creates an "overhead supply" that can stall even the most robust rallies.
- Macro Correlation: XRP has historically maintained a high correlation with the broader crypto market, specifically Bitcoin and Ethereum. A sudden shift in macroeconomic conditions, such as interest rate changes or regulatory news from the SEC, could invalidate the technical setup regardless of the strength of the impulse pattern.
- The $1.00 Psychological Barrier: Losing the $1.00 support level would be a major blow to the bull case. It would effectively nullify the current impulse thesis and force a reset of the macro-technical models, likely shifting the market focus toward the $0.75–$0.90 support zone identified by various analysts.
Final Thoughts for Investors
For the disciplined investor, the current chart offers a clear roadmap. The $1.10–$1.15 range acts as the immediate battlefield. A successful defense of this level, followed by a confirmed breach of the $1.46 resistance, would provide the necessary confirmation for the three-part impulse scenario. Conversely, a failure to hold these levels suggests that the market requires more time to build a base before attempting a meaningful recovery.
As with any volatile asset, the path forward is rarely a straight line. While the charts point toward a potential move into the $3.00 region, the journey will be paved with test-and-retest phases that will require patience and careful risk management. Traders are advised to watch the volume profiles at the $1.46 and $2.12 levels closely, as these will be the primary indicators of whether the bulls have the conviction to complete the sequence.
Ultimately, XRP remains a asset defined by its resilience. Whether the current setup marks a temporary relief or the start of a sustained bull run, the next thirty days of price action will likely define the asset’s trajectory for the remainder of the year.
