

The digital asset landscape is currently witnessing a period of pronounced volatility, with Solana (SOL) finding itself at a critical juncture. After a sustained period of bullish momentum, SOL has encountered significant resistance, failing to maintain its foothold above the $67 threshold. As the broader cryptocurrency market, led by Bitcoin and Ethereum, experiences a synchronized cooling-off period, Solana’s recent price action reflects a broader shift in investor sentiment, characterized by cautious profit-taking and a test of key technical support levels.
The Current State of the Market: A Brief Overview
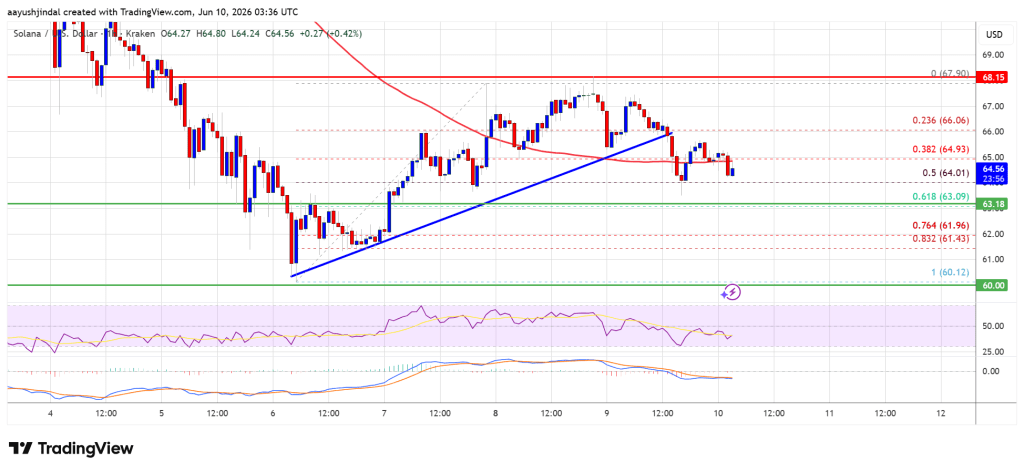
The recent price trajectory of Solana has been marked by a transition from optimism to consolidation. After rallying toward the $68 mark, the asset faced an abrupt reversal, triggering a cascade of sell orders that pushed the price below the critical $66 and $65 support zones. This movement has effectively shifted the short-term market structure into a bearish consolidation phase.
At the time of reporting, Solana is trading below both the $65 psychological level and the 100-hourly simple moving average (SMA). This technical positioning is a significant signal for traders, as the 100-SMA often acts as a dividing line between short-term bullish trends and bearish dominance. The inability of bulls to reclaim these levels suggests that the market is currently lacking the buying pressure required to initiate a sustained recovery.
Chronology of the Recent Correction
The decline did not happen in a vacuum. To understand where Solana is headed, one must analyze the sequence of events that led to the current price compression.
- The Peak: The recent bullish wave originated from a swing low of $60.12, climbing steadily to a peak of $67.90. This move was fueled by increased network activity and a general uptick in altcoin demand.
- The Breakdown: As the asset approached $68, liquidity began to thin. The failure to breach the $67.90 resistance triggered a technical breakdown, specifically piercing the 50% Fibonacci retracement level of the aforementioned upward wave.
- Trend Line Violation: A critical point in the chronology was the breach of the bullish trend line that had been supporting the SOL/USD pair on the hourly chart. Once the $66 support was lost, the technical outlook for the immediate term shifted from "cautious optimism" to "defensive posture."
- Testing the Floor: Following the breach, the price tested the $63.20 support level, confirming that sellers had temporarily gained control of the order flow.
Supporting Technical Data and Market Indicators
Technical analysis provides a granular view of why the current price action is being viewed with such scrutiny by institutional and retail analysts alike. The confluence of several indicators paints a picture of a market in flux.

The MACD and RSI Signals
The Hourly Moving Average Convergence Divergence (MACD) indicator is currently gaining momentum in the bearish zone. This suggests that the selling pressure is not merely a momentary flash, but a sustained movement. Furthermore, the Relative Strength Index (RSI) for the SOL/USD pair is currently hovering below the 50 level. In technical analysis, an RSI below 50 indicates that bearish momentum is currently overpowering bullish sentiment, suggesting that further downside could be possible if the RSI does not recover soon.
Fibonacci Retracement Levels
The Fibonacci tool, which measures the relationship between previous highs and lows, provides clear guidance on where the market is headed. The 61.8% retracement level, often referred to as the "golden pocket," is currently aligned with the $63.10 zone. This serves as a primary battleground for bulls and bears. A decisive break below this point would signal a full retracement of the recent gains, potentially opening the door for a retest of the $60 baseline.
Implications for Investors and Stakeholders
The current volatility in the Solana ecosystem carries significant implications for various stakeholders. For long-term holders, the price action is a reminder of the inherent risks associated with high-beta assets. For day traders, the current consolidation offers opportunities to trade within the defined $62–$66 range, though the risks of a breakout—in either direction—remain elevated.
The $67.20 Pivot Point
Looking ahead, the $67.20 level stands as the most critical resistance zone. A successful, sustained close above this level would be a major victory for the bulls, potentially invalidating the recent bearish structure and setting the stage for a push toward the $68 and, eventually, the $70 resistance levels. Conversely, the failure to reclaim this zone will likely invite more aggressive selling.
Downside Risks: The $60 Support
Should the support at $63.10 and $62.20 fail to hold, the market will turn its eyes toward the $60 support zone. This is a psychological and technical threshold of high importance. A breach and daily close below $60 would effectively negate the gains achieved over the last two weeks, potentially pushing the price toward the $55 support area.

The Broader Context: Why Altcoins are Stumbling
Solana’s price action is intricately linked to the performance of Bitcoin and Ethereum. When the market leaders enter a period of consolidation, capital often rotates out of riskier altcoin positions. The "stumble" mentioned in recent reports regarding Bitcoin’s inability to break the $64,000 threshold has served as a catalyst for a broader market contraction.
Investors are currently waiting for a clear signal from the macro-economic environment—interest rate expectations, inflation data, and institutional inflow reports are all contributing to the "wait-and-see" approach that has characterized the last 48 hours of trading.
Expert Perspective and Strategic Considerations
Market experts, including senior analysts who track the intersection of software engineering and financial modeling, note that Solana’s underlying network strength—often cited as its high throughput and low latency—remains a core fundamental value proposition. However, fundamentals often take a backseat to technical market cycles in the short term.
For those managing portfolios, the current advice often emphasizes risk management over speculative gains. Utilizing stop-loss orders around the $62.20 support level is a common strategy for those looking to protect capital while maintaining exposure to a potential rebound.
Conclusion
Solana finds itself in a classic corrective phase. While the bearish momentum is evident in the MACD and RSI readings, the support levels at $63.10 and $62.20 are currently being defended. Whether these levels hold will define the narrative for the coming week. Investors should monitor the $67.20 resistance closely; a break above this level would be the clearest sign that the bears have lost their grip.
As always, the digital asset market remains highly volatile. Investors are encouraged to conduct their own due diligence, monitor the broader movements of the crypto market, and maintain a disciplined approach to risk management. The intersection of technical signals and macroeconomic trends suggests that the next move for Solana will likely be decisive, making the coming days crucial for market participants.
Disclaimer: The information provided in this article is for educational purposes only and does not constitute financial advice. Trading cryptocurrencies involves substantial risk of loss. NewsBTC and its contributors are not responsible for any investment decisions made based on this analysis. Please conduct your own research or consult with a qualified financial advisor before entering any market positions.
