
The digital asset market is currently witnessing a period of heightened volatility, and Solana (SOL) has not been immune to these macroeconomic and technical headwinds. Following a failed attempt to maintain momentum above the $67 resistance level, the fifth-largest cryptocurrency by market capitalization has entered a corrective phase. Investors and traders are now closely monitoring key support zones to determine whether this dip is a temporary retracement or the beginning of a more protracted bearish trend.
The Current State of the Market: Main Facts
As of the latest market data, Solana is navigating a challenging landscape. Having been unable to consolidate above the psychological threshold of $67, the asset has succumbed to selling pressure, mirroring broader market movements seen in Bitcoin (BTC) and Ethereum (ETH).
The recent price action indicates a shift in sentiment among short-term traders. After reaching a recent swing high of $67.90, the token failed to sustain its upward trajectory, leading to a breakdown below the $66 and $65 support levels. This slide has pushed the asset into a short-term bearish zone, where it is currently struggling to find a stable footing. As the price dips below the 100-hourly simple moving average, the prevailing narrative among market participants is one of cautious observation, with many waiting for a clear signal of institutional accumulation before re-entering long positions.
A Chronology of the Recent Downtrend
To understand the current positioning of Solana, one must examine the sequence of events that led to the present technical structure.
The Initial Surge and Resistance
In the days leading up to the current correction, Solana displayed signs of renewed strength. The asset climbed from a swing low of $60.12, showing resilience as it tested higher resistance levels. This movement was characterized by increased trading volume, suggesting that retail and institutional interest was peaking as the price approached the $68 mark.

The Breakdown
The turning point occurred when the price failed to hold the $67 support level. The breakdown was swift, accompanied by a breach of a key bullish trend line on the hourly chart. Once the $66 support was invalidated, the momentum shifted decisively in favor of the bears.
Current Consolidation
Over the past 48 hours, Solana has attempted to stabilize near the $63.20 level. However, the lack of buying volume has prevented any meaningful recovery. The price is currently trapped in a narrow range, bounded by local resistance at $65 and support at $63.10, effectively creating a "no-man’s land" that discourages aggressive positioning from both bulls and bears.
Technical Analysis: Beneath the Surface
For traders, technical indicators provide a clearer picture of the forces at play. The current configuration suggests that the path of least resistance remains to the downside, provided specific thresholds are not reclaimed.
Fib Retracement and Key Levels
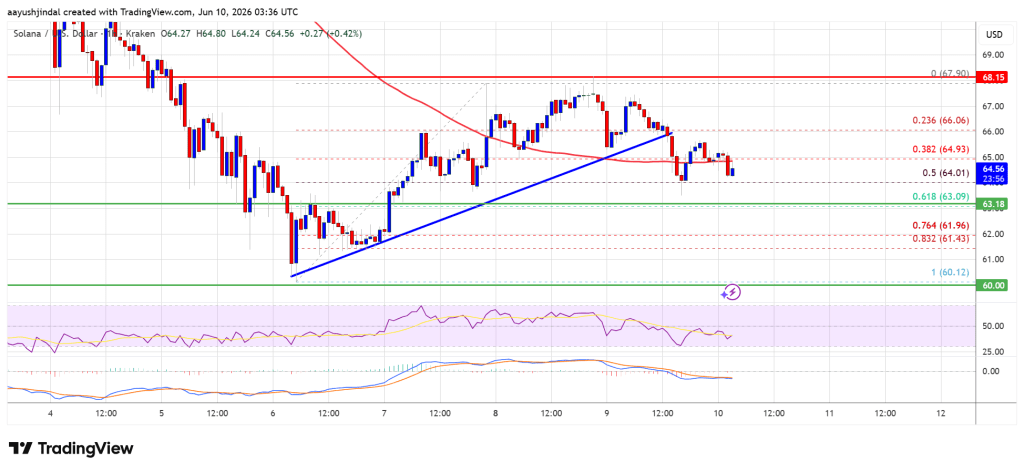
The price action is currently hovering around the 61.8% Fibonacci retracement level, calculated from the move between the $60.12 low and the $67.90 high. This is a critical juncture; historically, this level serves as a "make-or-break" point for assets in a correction.
- Upside Potential: To invalidate the current bearish thesis, Solana must achieve a daily close above the $67.20 resistance zone. Such a move would likely trigger a retest of $68, with a potential breakout toward $70.
- Downside Risk: Conversely, if the price fails to regain the $66 level, the next major target for the downside is the $62.20 support. A decisive break below this level could accelerate selling, pushing the price toward the major psychological support zone at $60.00, and potentially down to $55.00 if panic selling ensues.
Indicators and Momentum
The Moving Average Convergence Divergence (MACD) indicator currently reveals that momentum is gaining pace in the bearish zone. The histogram is consistently printing red bars, signaling that the selling pressure is not yet exhausted. Similarly, the Relative Strength Index (RSI) remains below the 50 neutral mark, indicating that bears are firmly in control of the short-term trend. Until the RSI climbs back toward 60, it is unlikely that a sustained recovery will materialize.
Implications for the Solana Ecosystem
The price volatility of the underlying native token, SOL, has significant implications for the broader Solana ecosystem, which includes decentralized finance (DeFi) protocols, non-fungible token (NFT) marketplaces, and various Web3 applications.
- DeFi Liquidity: As the price of SOL drops, the total value locked (TVL) in many Solana-based DeFi platforms often experiences a decline. This can lead to increased liquidation risks for users who have collateralized their SOL to borrow other assets, creating a potential cascading effect of sell orders.
- Network Activity: Historically, Solana has thrived on high throughput and low costs. While price fluctuations do not change the network’s underlying performance, they do impact developer sentiment and project funding. A prolonged downtrend may lead to a slowdown in new project launches as investors become more risk-averse.
- Market Sentiment: Solana has often been viewed as a high-beta asset compared to Bitcoin. This means that during market rallies, it tends to outperform, but during market corrections, it often suffers sharper declines. Investors currently view the $60 support level as a vital psychological barrier; holding this level is essential for maintaining confidence in the long-term bullish narrative of the network.
Expert Perspective: Navigating Volatility
Market analysts note that the current correction is not necessarily a reflection of fundamental flaws within the Solana network, but rather a byproduct of global market conditions and crypto-specific profit-taking.
"The current movement is a classic technical retest," says industry expert Aayush Jindal. "When an asset runs up from $60 to nearly $68, a correction is mathematically probable. The key for investors is to differentiate between a healthy retracement and a trend reversal. As long as the broader market remains sensitive to interest rate fluctuations and macroeconomic data, volatility should be expected. Investors should focus on the integrity of key support levels and avoid reacting to short-term noise."
Conclusion and Outlook
Solana finds itself at a critical crossroads. The technical setup is undeniably bearish in the short term, with indicators pointing toward further consolidation or a potential test of lower support levels. However, the crypto market is known for its rapid reversals.
For the bulls, the immediate goal is clear: reclaim the $66 level and build momentum to challenge the $67.20 ceiling. Achieving this would provide the necessary catalyst to negate the current bearish structure. For the bears, the objective is to capitalize on the lack of buying interest to drive the price toward the $60 support zone.
As we look toward the coming days, market participants should remain vigilant. The intersection of technical support levels and broader market sentiment will likely dictate the next major move for SOL. Whether the asset bounces back to retest the $70 level or descends further to consolidate near the $55-60 range remains to be seen. In the meantime, risk management remains the most important tool for any investor operating in this volatile environment.
Disclaimer: The information provided in this article is for educational purposes only and does not constitute financial, investment, or trading advice. Cryptocurrencies are highly volatile and carry significant risks. You are strongly advised to conduct your own independent research and consult with a professional financial advisor before making any investment decisions. The author and the publisher assume no responsibility for any losses or gains resulting from the use of this information.
