
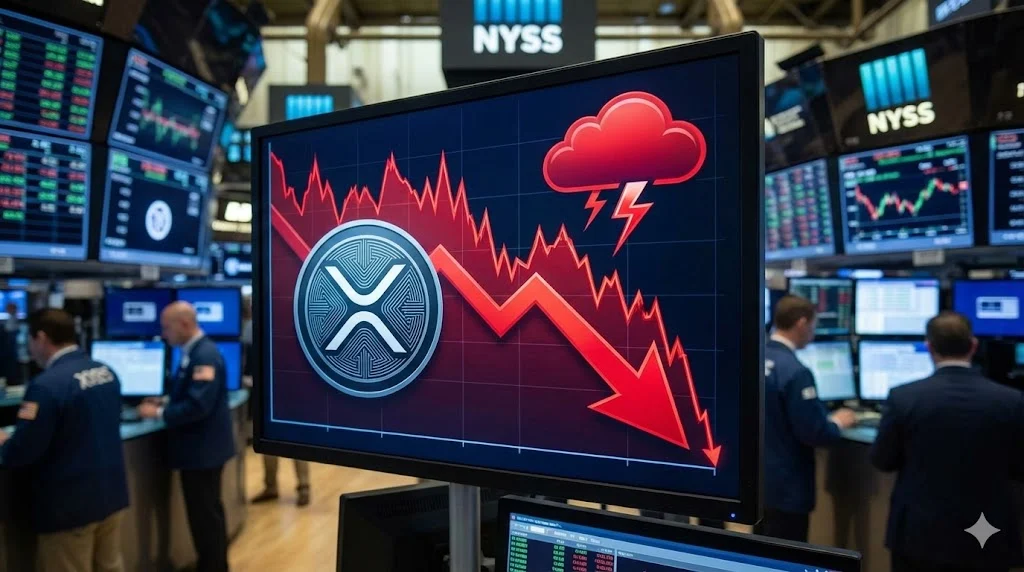
The cryptocurrency market is currently witnessing a period of heightened volatility, with XRP—the native asset of the Ripple ecosystem—finding itself at the center of a challenging technical correction. Following a recent failure to sustain momentum above the $1.150 threshold, the asset has entered a precarious phase of price discovery. As of the latest market data, XRP is exhibiting distinct bearish signals, leaving traders and institutional observers to question whether the digital asset will find a firm floor or slide further into a deeper consolidation phase.
Main Facts: The Current Technical Landscape
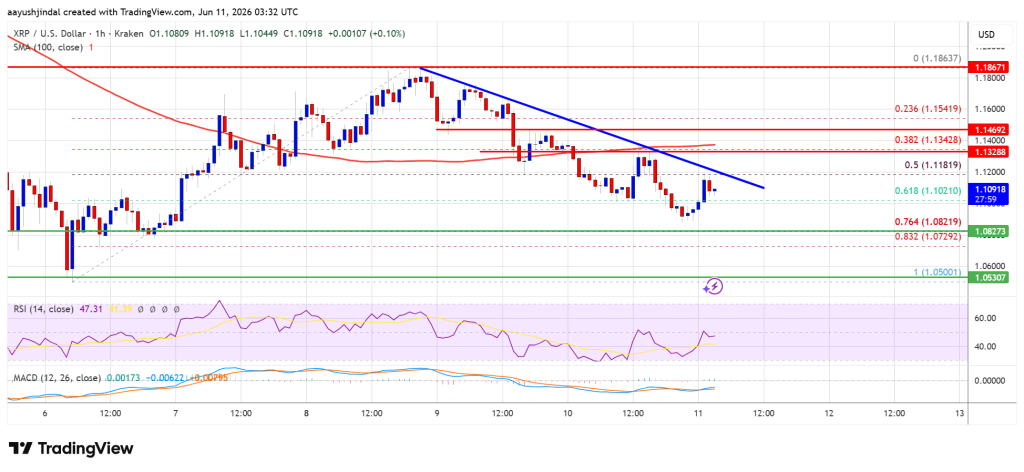
The recent price action for XRP has been characterized by a struggle for dominance between buyers and sellers. After reaching a swing high near $1.1862, the asset experienced a sharp retracement, dipping below the psychologically significant $1.150 and $1.1420 levels. This movement mirrors broader market trends, as both Bitcoin and Ethereum have also faced significant selling pressure, leading to a general "risk-off" sentiment across the digital asset class.
Currently, XRP is trading beneath the 100-hourly Simple Moving Average (SMA), a technical indicator that typically suggests a short-to-medium-term bearish trend. Furthermore, the asset is struggling to break above a descending trend line forming on the hourly charts, with immediate resistance established at $1.120. The inability of the bulls to reclaim this level has emboldened the bears, pushing the price to test lower support structures.
Chronology: The Road to the Recent Correction
To understand the current state of XRP, one must examine the progression of the last few trading sessions.
- The Surge: XRP began the week with a strong upward trajectory, climbing from a support base of $1.050. This bullish momentum was fueled by renewed interest in cross-border payment solutions and speculative volume, pushing the price toward the $1.1862 peak.
- The Resistance Wall: Upon hitting the $1.1862 level, the asset encountered a "wall" of profit-taking. The failure to breach the $1.20 psychological barrier served as a catalyst for a series of sell orders.
- The Breakdown: The decline accelerated as the price slipped below the 50% Fibonacci retracement level (calculated from the $1.050 low to the $1.1862 high). This breakdown signaled a shift in market sentiment from "buy the dip" to "sell the rallies."
- Current Status: As of today, the price is oscillating near the $1.10 zone, with the hourly MACD losing momentum in the bearish territory and the Relative Strength Index (RSI) hovering below the neutral 50 level, indicating that selling pressure is still currently outweighing buying enthusiasm.
Supporting Data: Quantitative Analysis of Market Indicators
The technical health of XRP is currently under close scrutiny by quantitative analysts. The confluence of several indicators paints a complex picture for the immediate future:

The Fibonacci Perspective
The asset has retraced significantly, now testing the 76.4% Fibonacci level of its previous upward move. This is a critical juncture. Historically, if an asset fails to hold above this specific retracement level, it often signals a total reversal of the preceding rally, potentially sending the price back toward the $1.050 starting point.
Moving Averages and Volume
The 100-hourly Simple Moving Average has now become a primary resistance barrier. When an asset trades consistently below this line, it confirms that the short-term trend has transitioned from accumulation to distribution. Additionally, trading volume has been relatively muted during the recent price drops, which suggests that while there is selling pressure, there is not yet a capitulation event—a scenario that could lead to even sharper, high-volume declines if support at $1.080 fails.
RSI and MACD Divergence
The hourly RSI, which measures the speed and change of price movements, is currently below 50. In technical analysis, an RSI under 50 is a classic indicator of bearish control. Simultaneously, the MACD histogram is showing declining bars in the negative zone, suggesting that the "bearish energy" is persistent rather than fleeting.
Official Responses and Institutional Perspective
While Ripple (the company) often maintains a neutral stance on the daily price volatility of XRP, market makers and institutional analysts have been vocal about the broader implications of these moves.
Institutional analysts emphasize that XRP’s price is currently highly sensitive to the regulatory clarity surrounding Ripple’s ongoing legal developments. Many observers note that the price action is less about fundamental utility and more about macro-market liquidity. When Bitcoin faces downward pressure, altcoins like XRP often see a "beta" effect, where their losses are amplified due to lower liquidity compared to major digital assets.
Leading market participants suggest that the $1.10 support level is the "line in the sand." Should this level fail to hold, the market expects a rapid descent toward $1.080 and potentially $1.050. Conversely, a reversal would require a massive influx of volume to clear the $1.1350 resistance, which would invalidate the current bearish pattern.
Implications: What Comes Next?
The current market environment poses several implications for both short-term traders and long-term holders.
For Short-Term Traders
The current setup suggests a "sell-the-rally" environment. Traders are likely looking at the $1.120–$1.1350 resistance zone as an ideal entry point for short positions, targeting the $1.080 and $1.050 support levels. The risk, of course, is a "bull trap," where a sudden spike in price above $1.1420 could trigger a short squeeze, forcing the price back toward $1.1862.
For Long-Term Holders
For investors with a longer time horizon, the current correction may be viewed as noise. However, the breach of the 100-hourly SMA is a signal to monitor the asset’s health more closely. If the price continues to slide toward $1.00, it would represent a significant psychological defeat for the bulls, potentially leading to a period of stagnation that could last several weeks or months.
Potential Support and Resistance Scenarios
- The Bullish Case: If XRP manages to reclaim the $1.1420 level with high volume, it would negate the current bearish structure. From there, the path to $1.1650 and ultimately $1.1840 becomes clear.
- The Bearish Case: If the $1.080 support level is breached, the floodgates may open toward $1.0650 and $1.050. If $1.050 breaks, the next major target for the bears is the round number of $1.00, a level that has historically acted as a massive magnet for both buyers and sellers.
Conclusion: A Critical Juncture
XRP is currently at a technical crossroads. The transition from a bullish trend to a consolidation phase is never linear, and the current volatility reflects the uncertainty of the wider crypto market. Whether XRP recovers or faces further downside will depend heavily on whether the $1.10 support can hold against the encroaching bearish momentum.
As always, investors are reminded that the cryptocurrency market is characterized by extreme volatility. Technical indicators provide a roadmap, but they are not guarantees of future performance. With the RSI and MACD signals currently pointing toward a continuation of the downtrend, the coming hours and days will be instrumental in determining the long-term trend for the asset. Market participants should remain cautious, conduct their own due diligence, and prioritize risk management in an environment where the next move is anything but certain.
Disclaimer: The information provided in this analysis is for educational purposes only and does not constitute financial advice. Investing in cryptocurrencies involves substantial risk of loss. Always perform your own research before making investment decisions.
