
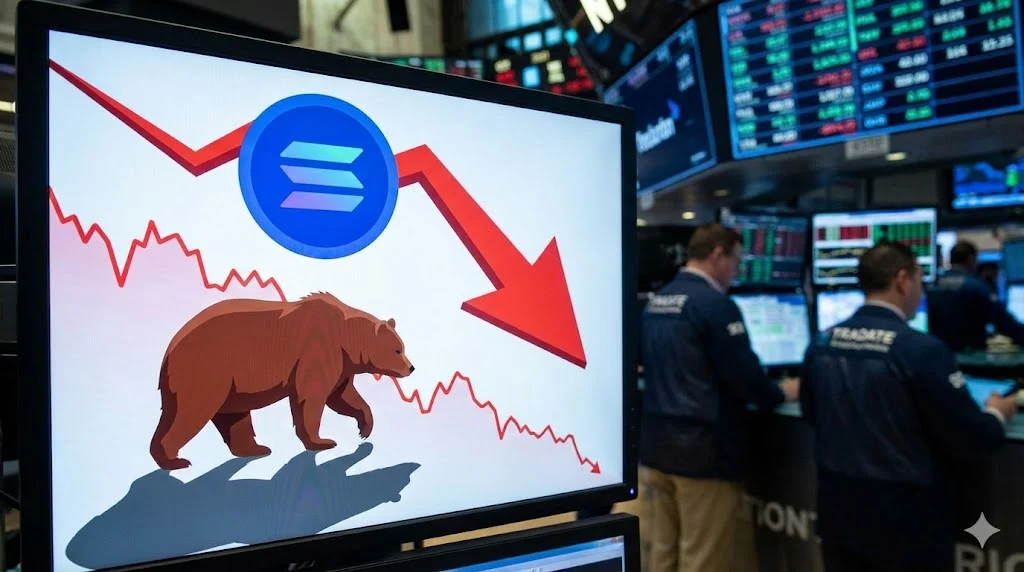
In the fast-paced and often volatile world of decentralized finance, Solana (SOL) has recently found itself in a precarious position. After failing to maintain critical support levels above the $67 threshold, the asset has entered a corrective phase, mirroring broader market trends seen in industry titans like Bitcoin and Ethereum. As investors closely monitor the charts, the question remains: is this a temporary pullback or the beginning of a deeper bearish trend?
Main Facts: The Current State of SOL
As of the latest market sessions, Solana has experienced a notable shift in sentiment. The asset, which recently showed signs of bullish momentum, has slipped below key psychological support levels of $66 and $65. This move has pushed the SOL/USD pair into a short-term bearish zone, characterized by increased selling pressure and a lack of immediate buying conviction at lower levels.
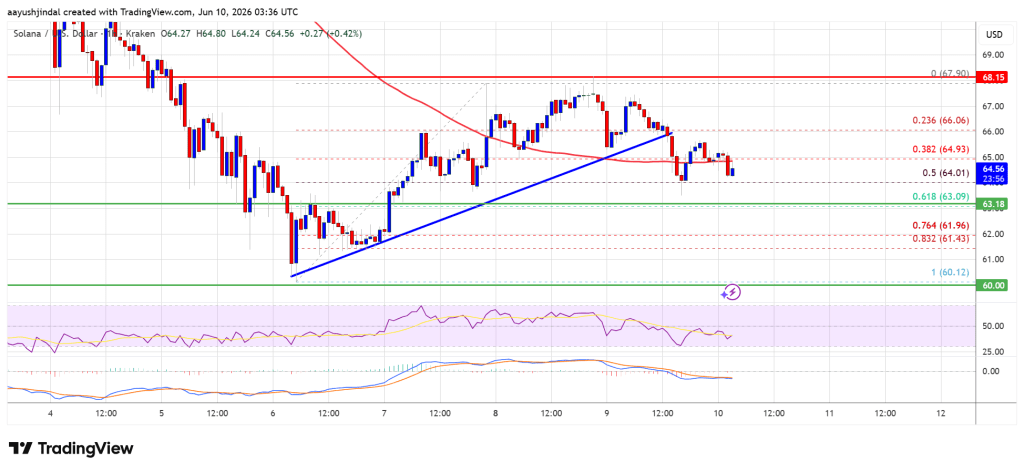
Technical analysis reveals that the price has failed to sustain a breakout above the $67.90 high, leading to a retracement that saw the asset test support near $63.20. Currently, Solana is trading beneath its 100-hourly simple moving average—a clear indicator that the short-term trend has tilted in favor of the bears.
Chronology of the Decline
The recent price action for Solana can be traced through a series of technical breakdowns that occurred over the last 48 to 72 hours:
- The Rejection: SOL attempted to establish a firm base above $67, but the momentum was insufficient to overcome the selling wall at $67.90.
- The Trendline Break: A significant turning point occurred when the price broke below a critical bullish trendline that had previously provided support at the $66 level on the hourly chart.
- Fibonacci Retracement Failure: The asset dropped below the 50% Fibonacci retracement level of the upward wave that originated from the $60.12 swing low. This failure to hold the midpoint of the previous rally signaled to traders that the buying interest had significantly waned.
- Testing the Floor: Following the breach of the $66 and $65 supports, the price slid further, eventually touching the $63.20 support level, which is currently acting as a psychological buffer for bulls.
Supporting Technical Data
To understand the gravity of the current situation, one must look at the quantitative indicators currently governing the SOL/USD pair:

1. MACD (Moving Average Convergence Divergence)
The hourly MACD for SOL/USD is currently gaining pace within the bearish zone. This suggests that the momentum of the decline is strengthening rather than exhausting, indicating that sellers remain in control of the near-term price action.
2. Relative Strength Index (RSI)
The RSI, a measure of whether an asset is overbought or oversold, is currently trending below the 50-level on the hourly chart. This confirms the absence of bullish momentum and provides room for further downside movement before the asset enters "oversold" territory.
3. Key Support and Resistance Levels
For traders and institutional investors, the following levels are critical in determining the next leg of the move:
- Immediate Resistance: $65.00 and $67.20. A successful close above $67.20 is required to invalidate the current bearish narrative.
- Primary Support: $63.10 and $62.50. A break below these levels could trigger a secondary wave of liquidations.
The Implications of a Sustained Downturn
If Solana fails to reclaim the $66 resistance level, the technical outlook suggests a deeper correction. Market analysts are watching the $62.20 level with particular interest; a decisive break below this point would likely lead to a test of the $60 support zone.
The long-term implications of falling below $60 are significant. Should the price close below this psychological support, it would effectively negate the gains accumulated over the past month, potentially opening the door for a slide toward the $55 support level. Conversely, if the bulls can defend the $63 zone and push back toward $67.20, the path could clear for a re-test of the $68 and $70 milestones, potentially reigniting investor confidence.
Comparative Market Context
Solana does not exist in a vacuum. The current "slip" in price is heavily correlated with the performance of the wider crypto ecosystem. Bitcoin, the industry bellwether, has also faced resistance near the $64,000 mark, leading to a general "risk-off" sentiment among retail and institutional traders. Ethereum’s inability to sustain a rebound above $1,700 has further exacerbated the selling pressure across altcoins, including Solana.
When the leading assets experience a lack of direction, lower-cap assets or high-beta assets like Solana often experience amplified volatility. Consequently, SOL’s current performance is less an indictment of its underlying technology and more a reflection of the broader macroeconomic and crypto-market stagnation.
Expert Perspective on Volatility
According to market experts who have spent years navigating the complexities of Forex and crypto trading, such as Aayush Jindal, the key to surviving these periods lies in disciplined risk management and a clear understanding of technical patterns.
"In a world where uncertainty reigns supreme," says industry veteran Aayush Jindal, "the ability to identify key support and resistance levels is what separates those who preserve capital from those who succumb to market noise." Jindal, who utilizes a blend of software engineering logic and deep financial market experience, suggests that traders should focus on the confluence of indicators rather than isolated price movements.
The current environment, marked by shifting regulatory tones and macroeconomic indicators, makes it essential for investors to remain objective. As Jindal notes, the market often tests the resolve of holders by breaching key levels to trigger stop-loss orders before initiating a genuine reversal.
Strategic Outlook for Investors
For those currently holding or considering a position in Solana, the situation demands caution.
- Wait for Confirmation: Instead of "catching a falling knife," prudent investors often wait for a base to form or a clear trendline break to the upside.
- Monitor Volume: A price move without volume is often a "fake-out." Any attempt to reclaim $66 should be accompanied by a significant uptick in trading volume to confirm buyer conviction.
- Manage Leverage: In high-volatility environments, the use of leverage can lead to rapid account depletion. Reducing exposure or tightening stop-losses during periods of sub-50 RSI is a common defensive strategy.
Conclusion
Solana stands at a crossroads. While the technical indicators currently paint a picture of short-term weakness, the blockchain’s underlying utility and ecosystem growth remain intact. The price action between $60 and $67 will be the primary battleground for the coming week.
Investors are reminded that the crypto market is inherently speculative. As outlined in the disclaimer, the information provided is for educational purposes and should not be considered financial advice. Market conditions change rapidly, and thorough personal research is the only safeguard against the inherent risks of digital asset investment. Whether SOL finds its footing at $63 or experiences a deeper correction, the market remains a testament to the persistent tug-of-war between supply and demand in the digital age.
Disclaimer: The information found on NewsBTC is for educational purposes only. It does not represent the opinions of NewsBTC on whether to buy, sell, or hold any investments. Investing in cryptocurrencies carries significant risks. You are advised to conduct your own research before making any investment decisions. Use the information provided on this website entirely at your own risk.
