
The cryptocurrency market is currently witnessing a high-stakes standoff involving XRP, as bulls attempt to pivot from a period of brutal, sustained selling pressure toward a more substantial recovery. After enduring a volatile stretch that tested critical psychological support levels, the asset is showing technical configurations that have piqued the interest of market analysts.
The core of the current debate centers on whether the recent bottoming process—centered near the $1.05 to $1.12 range—is merely a temporary relief bounce or the ignition point for a larger, multi-stage impulsive move. As XRP hovers in this precarious zone, market participants are dissecting complex wave structures to determine if the asset is poised for a breakout toward its previous all-time highs or if it remains shackled to a deeper, more protracted macro correction.
Chronology: Mapping the Macro Corrective Sequence
To understand where XRP is headed, one must first reconcile with where it has been. The current technical landscape is best viewed through the lens of a "W-X-Y" double zigzag, a pattern that has defined the cryptocurrency’s price action over the last twelve months.
The Foundation: Wave W and the February Low
The sequence began with a significant decline from the peaks observed above $3 last year. This initial descent was characterized by a classic A-B-C structure, which found its floor in early February. This low, marked on technical charts as the (C)/(W) point, served as the initial foundation for the subsequent market cycle. For many, this point represents the first major capitulation phase, where weak hands were shaken out of the market.
The Linking Wave X
Following the February lows, XRP experienced a corrective counter-rally. Throughout the middle of May, market sentiment turned cautiously optimistic as the price pushed above the $1.50 threshold. This phase, identified as the "linking wave X," displayed its own internal (X)-(A)-(B) structure. However, the momentum proved unsustainable, and the market eventually succumbed to renewed selling pressure, leading to the rollover that characterized late spring and early summer.
The Current Landscape: Wave Y
We are currently residing in the final leg of this sequence, the "Y" wave. This wave has tested the resolve of XRP bulls, pushing prices down to the $1.12 range at the time of writing. The critical question for investors is whether this current test of support at $1.05–$1.12 represents the absolute bottom of the macro correction or merely a temporary floor before further downside.
Technical Analysis: The Three-Part Impulse Setup
The prevailing bullish thesis relies on the theory that XRP is transitioning from a corrective phase into a "three-part impulse wave." This structure, if realized, would suggest a significant structural shift in the asset’s long-term trajectory.
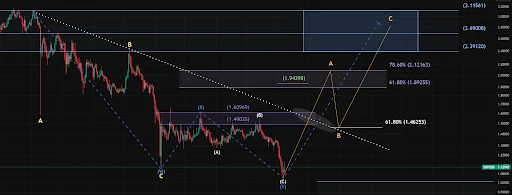
Wave A: Testing the Resistance
The first phase of this projected recovery, Wave A, targets the $2.12 level. This move is not expected to be a vertical climb; rather, it will encounter significant friction. Analysts point to the $1.46 zone as a primary "make-or-break" level—a former support turned resistance that must be reclaimed to validate the bullish case. A successful breach of this level would provide the necessary confirmation that the selling pressure has been exhausted.
Wave B: The Strategic Pullback
Following the initial surge to $2.12, the model anticipates a retracement back toward the $1.46 mark. While casual traders might interpret this dip as a return to bearish conditions, technical analysts view this as a healthy "shakeout." This retest of support is considered essential for stabilizing the price before the final, and most explosive, leg of the movement.

Wave C: The Target Zone
Wave C represents the climax of the three-part structure. Should the support at $1.46 hold during the Wave B pullback, the projected target for this final leg lies between $2.70 and $3.10. Reaching this band would be a monumental achievement for the bulls, as it would effectively bring XRP back to the doorstep of its historical highs.
Supporting Data and Market Sentiment
The technical setups shared by market observers, such as the RWA_Investor on X, highlight the reliance on wave theory to navigate the noise of current market volatility. However, the price action is not occurring in a vacuum.
Recent trading interest has seen spikes in activity, suggesting that while the price has been volatile, liquidity remains deep. The $1.10 level has become a psychological battleground; maintaining this level is vital to preventing a slide into the $0.75–$0.92 range. Analysts have repeatedly flagged the $0.87 to $0.92 zone as the "ultimate" buying opportunity should the current support fail to hold. If the price were to drop to these levels, it would likely signify that the macro "Wave 2" correction is still in its infancy, requiring a longer timeline for the anticipated recovery.
Official Responses and External Factors
While institutional entities rarely comment on short-term price movements, the broader regulatory and ecosystem context continues to influence XRP’s price. The ongoing legal and regulatory clarity surrounding Ripple has been a double-edged sword; while it has fostered institutional adoption, it has also created periods of extreme sensitivity to news-driven sentiment.
Market analysts note that the current setup is highly sensitive to the overall health of the broader cryptocurrency market. XRP, being a high-beta asset, tends to amplify the moves of Bitcoin. Therefore, any impulse move for XRP will likely require a concurrent period of stability or growth in the Bitcoin market to provide the necessary tailwinds for a sustained breakout.
Implications: A New All-Time High?
The ultimate implication of a successful three-part impulse is a potential trend reversal toward new all-time highs. If XRP can decisively break through the $3.10 resistance band, the current technical structure suggests that the macro bottom of $1.05 will have been firmly established.
For the average investor, this indicates a period of high volatility but also high potential. The structure implies that the "easy money" phase of the recovery is still ahead, provided that the current support zones hold. Conversely, failure to sustain these levels could lead to a protracted period of accumulation, where the asset remains range-bound between $0.80 and $1.30 for the foreseeable future.
Summary of Key Thresholds:
- Critical Support: $1.05 – $1.12 (The current defensive line).
- Primary Resistance: $1.46 (The gateway to the impulse phase).
- Secondary Resistance: $2.12 (The completion of Wave A).
- Target Objective: $2.70 – $3.11 (The culmination of the three-part impulse).
- Bearish Contingency: $0.75 – $0.92 (The safety net for a deeper correction).
As XRP continues to oscillate around these critical levels, the market remains in a state of heightened anticipation. Whether the asset breaks upward to complete its impulsive structure or falls back into a corrective consolidation, one thing is certain: the next few weeks will be pivotal in defining the long-term trajectory for one of the most closely watched assets in the crypto ecosystem. Investors are advised to monitor the $1.46 resistance level closely, as it will likely serve as the primary indicator of which path the market ultimately chooses.
