


The global cryptocurrency market is currently witnessing a pivotal shift in investor sentiment. For months, the primary discourse surrounding Bitcoin (BTC) focused on the legitimacy of "local bottoms"—temporary price floors established during volatile consolidation phases. However, as Bitcoin decisively breaks above the $66,000 threshold, the conversation has matured. Market participants and institutional analysts are now increasingly debating whether the asset has officially established a macro-cycle bottom, signaling the potential start of a sustained long-term bull run toward the $70,000 resistance level and beyond.
The Technical Argument: A Triad of Historical Signals
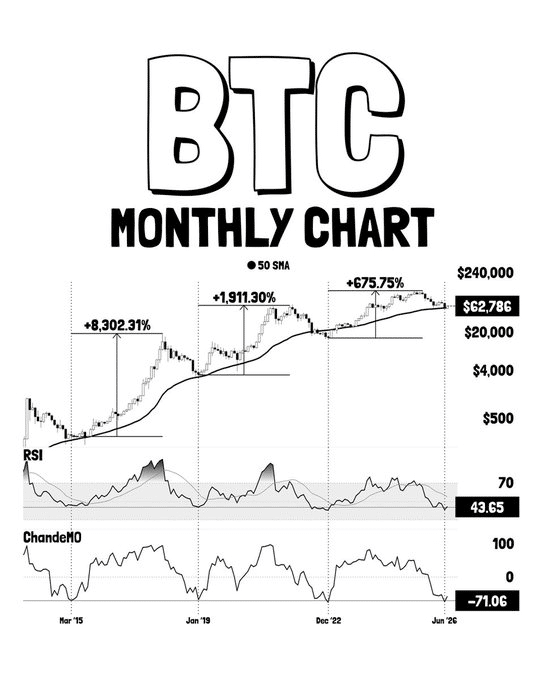
The optimism currently permeating the market is not merely rooted in speculative hope; it is bolstered by specific, historically significant technical alignments. Renowned crypto analyst Ali Martinez recently highlighted a "technical trifecta" that has consistently preceded major market reversals in Bitcoin’s history.
This cluster of indicators includes:
- Monthly Relative Strength Index (RSI): A drop to the 43.65 level, historically associated with oversold conditions that trigger massive institutional accumulation.
- Chande Momentum Oscillator (CMO): A decline to roughly -71, signaling that downward momentum has been exhausted.
- Moving Average Alignment: Bitcoin’s trading proximity to its 50-month moving average, a level that has served as a bedrock for long-term support throughout the asset’s existence.
Chronology of Historical Precedents
To understand the weight of these signals, one must look at the historical trajectory of Bitcoin. This specific technical setup has appeared at the nadir of previous market cycles:
- 2015: The signals flashed when Bitcoin was trading at approximately $235. This alignment preceded an unprecedented bull market that saw BTC rally over 8,300%.
- 2019: The indicators re-emerged near the $3,333 price point. This preceded a significant recovery period, resulting in gains of roughly 1,900%.
- 2022: As the market reeled from the fallout of various industry collapses, the cluster returned at the $16,000 level. This marked the bottom of the bear market, setting the stage for a 675% recovery leading into the current cycle.
When Bitcoin corrected to $58,000 last month, this exact configuration manifested for the fourth time. If history serves as a reliable guide, the current price action is not a mere "local" rebound, but the final stage of a long-term accumulation phase that precedes parabolic expansion.
Supporting Data: The Liquidity Paradox
While the technical charts suggest a macro bottom has been formed, the on-chain data presents a more complex, nuanced reality. A successful, sustained rally requires more than just historical chart patterns; it requires the fuel of liquidity. Currently, the market is facing a "liquidity paradox."

The Stablecoin Dilemma
Stablecoins serve as the "dry powder" of the crypto ecosystem. When investors move capital into stablecoins, they are effectively parking funds to buy assets during dips. However, current data suggests a tightening of this liquidity:
- Stablecoin Dominance: This metric has climbed to approximately 13%, indicating that capital is fleeing from volatile assets into stable assets.
- Market Cap Erosion: The total stablecoin market capitalization has retracted by over $10 billion in the last 30 days. This indicates that capital is not merely moving between coins, but is actively exiting the crypto ecosystem to return to fiat or traditional finance.
Exchange Flows and Accumulation
Data from CryptoQuant paints a cautious picture. While Bitcoin has successfully held the $65,000 support line, there has been a 35-day streak of stablecoins exiting exchanges. Simultaneously, there has been no significant, sustained surge in spot accumulation by large-scale holders (whales).
Essentially, the price is rising, but the underlying "fuel"—the liquidity needed to push past the $70,000 barrier—is currently stagnant. This discrepancy creates a risk of a "fake-out," where the price rises on thin volume, only to be met by a sharp rejection at the next major liquidity wall.
Institutional and Expert Perspectives
Market analysts remain divided on how to interpret this divergence. Some argue that the institutional adoption of Bitcoin ETFs has fundamentally altered the "liquidity" argument.
"In the past, we relied on exchange-based stablecoin inflows to track retail participation," says one senior market strategist. "Today, we have to look at ETF inflows as the new primary liquidity driver. The fact that BTC is holding $66k without retail stablecoin inflows suggests that institutional demand—which is more sticky—is absorbing the supply."
Conversely, other experts caution that without a broad base of liquidity, the market remains fragile. If the macro environment—defined by interest rates and inflation data—turns sour, the lack of fresh, retail-driven stablecoin liquidity could make the $66,000 support level extremely vulnerable to sudden liquidation events.
Implications for the Future
The implications of this transition from a local to a macro bottom are profound. If the "Macro Bottom" hypothesis holds true, the market is currently in the "accumulation of a lifetime." Investors who view the current price action as the beginning of a long-term cycle are likely to ignore short-term volatility in favor of multi-year holding strategies.
However, the liquidity constraints present a significant hurdle for the short-to-medium term. Investors should prepare for three potential scenarios:
- The Sustained Breakout: If stablecoin liquidity begins to flow back into exchanges, the market will likely clear the $70,000 resistance with ease, confirming the macro-bottom theory and potentially leading to a new all-time high (ATH).
- The Re-test: In the absence of liquidity, a "test" of the $60,000–$62,000 range is highly probable. This would allow the market to shake out weak hands before a more organic, liquidity-backed move upward.
- The Range-Bound Stagnation: If capital continues to exit the ecosystem, Bitcoin may remain trapped in a wide, high-volatility range between $60,000 and $68,000 for an extended period, preventing a clear trend for the remainder of the quarter.
Conclusion: A Delicate Balancing Act
Bitcoin stands at a critical juncture. The technical indicators are singing a chorus of bullish sentiment, echoing the patterns that heralded some of the most significant bull runs in financial history. Yet, the on-chain reality of fading liquidity serves as a sobering reminder that market dynamics are governed by more than just patterns.
Investors and traders should monitor the stablecoin market capitalization and exchange inflow data as closely as they monitor the $70,000 resistance level. The transition from a local bottom to a macro bottom is not a single event, but a process—one that requires the convergence of technical strength and fundamental capital support. Until the liquidity gap is closed, the path toward a new, sustained rally remains a path guarded by significant skepticism.
For now, the market remains in a "wait and see" mode, balancing the weight of historical precedent against the current reality of a cautious, capital-tight environment. The $66,000 mark is no longer just a price point; it is the line in the sand between a fleeting local recovery and the potential dawn of a major bull market cycle.
