

In the intricate architecture of global financial markets, liquidity acts as the lifeblood that sustains price discovery and momentum. When liquidity evaporates, assets often experience a "de-risking" cascade, separating true market bottoms from prolonged, soul-crushing bear phases. As the digital asset ecosystem grapples with a challenging macroeconomic environment, investors are turning their attention toward a critical indicator: stablecoin flows.
Recent data paints a sobering picture of the current state of crypto liquidity. With the stablecoin market capitalization shrinking by nearly $10 billion since May—including a massive $7.7 billion exodus in June alone—the industry is witnessing its most aggressive contraction since the catastrophic Terra-Luna collapse of May 2022. This shift suggests that capital is not merely rotating; it is departing, signaling that the market remains trapped in a persistent "risk-off" environment.
The Anatomy of the Liquidity Contraction: A Chronology
To understand where the market is going, one must first map where it has been. The recent liquidity drain did not occur in a vacuum; it followed a specific trajectory that mirrors the structural weaknesses observed during the 2022 bear market cycle.
May 2024: The First Warning Signs
The turbulence began in earnest in May, as macroeconomic headwinds began to weigh heavily on risk assets. Bitcoin, the bellwether for the entire ecosystem, faced a 3.6% correction. While a single-digit decline is often viewed as "healthy volatility" in crypto, it was accompanied by a subtle but ominous shift: the beginning of a sustained decline in stablecoin market capitalization. Investors began redeeming their stablecoins for fiat currency, a clear indicator that market participants were seeking an exit from the ecosystem rather than waiting for a dip to buy.
June 2024: The Capitulation Phase
June marked a significant acceleration in this trend. Bitcoin plummeted by 20.45%, a sharp decline that stripped away the optimism built earlier in the year. The contraction of the stablecoin market cap by $7.7 billion in this single month was the most substantial outflow in four years. This was not merely profit-taking; it was a systemic withdrawal of capital. By the end of June, the market was displaying the classic hallmarks of a liquidity-starved environment, where every sell order exerts a disproportionate downward pressure on prices.
Supporting Data: Dissecting the "Stablecoin Exodus"
The primary concern for analysts is not just the volume of the outflow, but the destination of that capital. In traditional finance, when risk assets decline, capital typically seeks refuge in "safe-haven" assets such as gold or government bonds. However, the current cycle has defied this historical precedent, presenting a unique anomaly.
The Failure of the Safe-Haven Rotation
In a classic flight to safety, one would expect the capital exiting stablecoins to flow into gold. Instead, gold prices faltered alongside crypto, closing May down 1.6% and plunging another 11.73% in June. This suggests that the current liquidity crisis is not an intra-market rotation but a broader retreat of capital from both the crypto and commodity spheres.
Stablecoin Dominance (STABLE.D) as a Leading Indicator
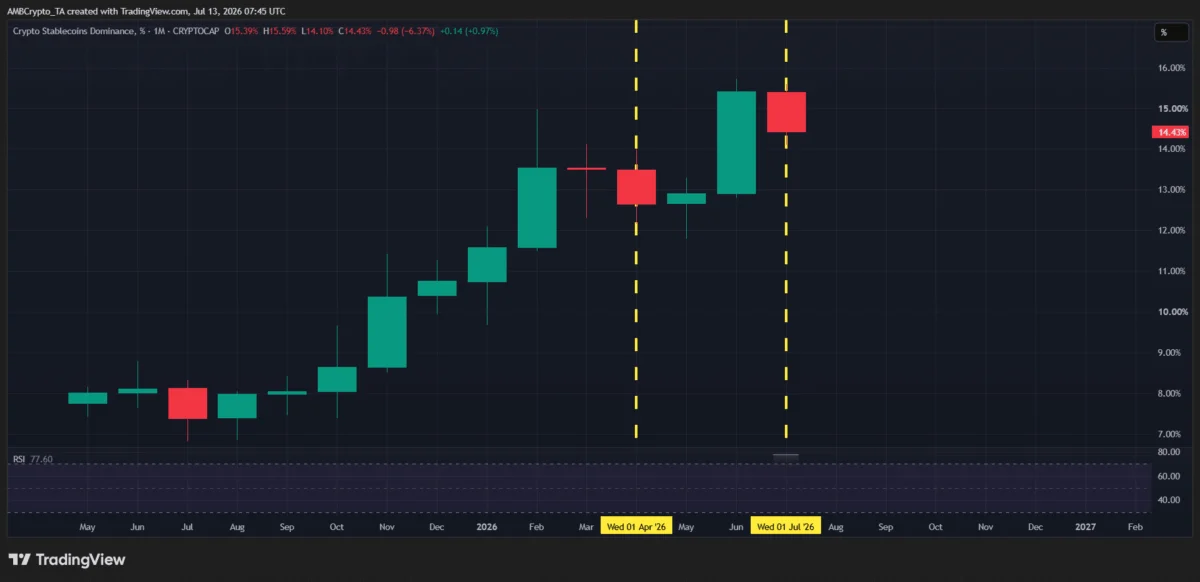
Despite the gloom, there is a glimmer of hope found in the technical analysis of Stablecoin Dominance (STABLE.D). After a 20% climb over the previous two months—which served as a proxy for the rise in investor fear—STABLE.D has recently begun to soften, falling 6.5% so far this month.
This drop in dominance is critical. It implies that the rate of capital outflow is slowing. Simultaneously, Bitcoin Dominance (BTC.D) has remained stubbornly anchored around 60%. This is a pivotal divergence from the 2022 bear market. In 2022, Bitcoin dominance suffered as investors lost faith in the entire asset class. Today, the fact that Bitcoin maintains its share of the market, even while stablecoin liquidity is fleeing, suggests a "Bitcoin-centric" resilience. Investors are selling their altcoins or stablecoins, but they are retaining their conviction in the primary digital asset.
Implications for the Future: Is a Bottom Near?
The current market configuration presents a complex puzzle. If the liquidity contraction continues at the pace seen in May and June, the market is likely headed for a prolonged, stagnant bear phase reminiscent of the "crypto winter." However, if the recent cooling of Stablecoin Dominance is a precursor to a stabilization phase, we may be approaching a structural bottom.
The "Bitcoin-Centric" Thesis
The resilience of Bitcoin dominance despite the massive liquidity drain is the most important indicator of this cycle. It suggests that while the "speculative froth" has been removed from the market, the core base of long-term holders remains intact. Unlike 2022, where liquidity broadly exited the ecosystem in a panic, the current environment shows a more calculated, if cautious, stance.
The Path to Recovery
For a sustainable recovery to materialize, the following conditions must be met:
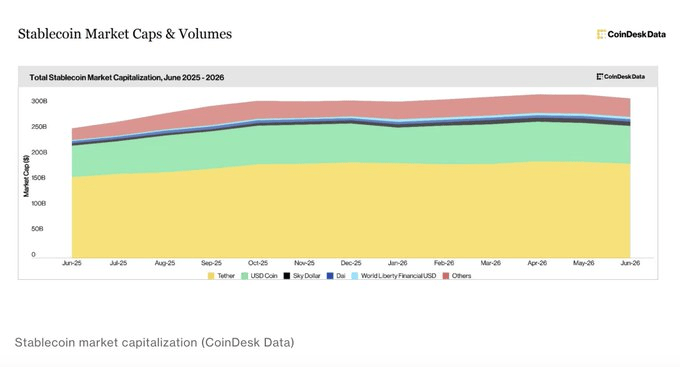
- Stablecoin Inflows: The reversal of the multi-billion dollar outflow is the primary prerequisite. When the market cap of stablecoins begins to trend upward, it indicates that "sideline capital" is re-entering the ecosystem.
- STABLE.D Breakdown: A continued decline in Stablecoin Dominance would signal that investors are feeling confident enough to deploy their cash into higher-beta assets.
- Macroeconomic Decoupling: As long as crypto remains highly sensitive to traditional market corrections (like the one seen in gold), it will remain vulnerable to external liquidity shocks. A decoupling—where Bitcoin holds or rises while traditional markets fluctuate—would mark a significant maturation of the asset class.
Expert Analysis and Official Perspectives
Industry analysts at AMBCrypto have noted that this cycle is fundamentally different from previous ones due to the increased institutional involvement. Unlike the retail-driven crashes of the past, the current liquidity dynamics are influenced by large-scale institutional rebalancing.
"The divergence between stablecoin outflows and Bitcoin dominance is the story of the summer," says one market observer. "We are seeing a ‘cleansing’ of the market. The speculators who entered during the hype phase are gone, leaving behind a market that is increasingly focused on the long-term viability of Bitcoin as a store of value. The bottom won’t be a V-shaped recovery, but rather a slow, grinding process of liquidity replenishment."
Final Summary and Outlook
The cryptocurrency market is currently navigating a period of intense liquidity pressure. The contraction of nearly $10 billion in stablecoin capital since May represents a significant challenge to short-term price action. However, the data also provides a roadmap for recovery.
The absence of a rotation into gold, paired with the stabilization of Bitcoin dominance at 60%, indicates that the market is not experiencing a total collapse of confidence, but rather a liquidity-driven consolidation. As we move through the second half of the year, the key metric to watch is the STABLE.D trend line. Should it continue to decline, it will serve as the first tangible evidence that the tide of liquidity is turning, potentially marking the beginning of the next phase of the Bitcoin cycle.
Investors are advised to look past the short-term price volatility and focus on the flow of capital. In a market where liquidity is king, the return of stablecoin growth will be the ultimate signal that the "risk-off" phase has concluded, paving the way for a more stable and resilient market environment.
