

The cryptocurrency market is currently navigating a period of heightened volatility, with XRP, the native token of the Ripple ecosystem, finding itself at a critical technical juncture. Following a failed attempt to maintain momentum above the $1.1550 threshold, the asset has entered a corrective phase, mirroring the broader market sentiment that has similarly affected major digital assets like Bitcoin and Ethereum. As the price struggles to regain its footing, traders and analysts are closely monitoring key support levels to determine whether this downward trajectory is a temporary retracement or the beginning of a more sustained bearish trend.
Main Facts: The Current Technical Landscape
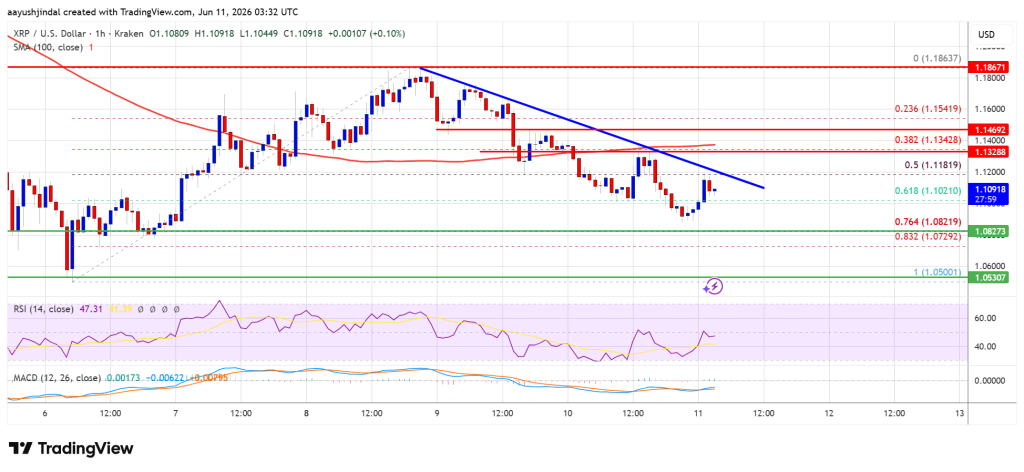
XRP has exhibited signs of fatigue after failing to hold the $1.1550 resistance zone. The subsequent decline saw the asset slip below both the $1.150 and $1.1420 support levels, signaling a shift in market control from buyers to sellers.
On the hourly chart, the XRP/USD pair is currently trading below the 100-hour Simple Moving Average (SMA), a bearish indicator that suggests short-term momentum is firmly in favor of the bears. Furthermore, the price has breached the 50% Fibonacci retracement level, calculated from the swing low of $1.050 to the recent high of $1.1862. Currently, a bearish trend line is forming, providing a formidable ceiling at the $1.120 level.
The immediate outlook remains cautious, as the price needs to clear significant resistance hurdles before any bullish reversal can be considered plausible.

Chronology: The Path to the Recent Downturn
To understand the current state of XRP, one must look at the recent price action:
- The Surge: XRP previously enjoyed a period of upward momentum, rallying from a swing low of $1.050 to hit a peak of $1.1862. This move was characterized by strong buyer participation and positive market sentiment.
- The Resistance Test: Upon reaching the $1.1862 high, the asset faced immediate selling pressure. Multiple attempts to stabilize above $1.1550 proved unsuccessful, leading to a consolidation that eventually gave way to a breakdown.
- The Breakdown: The failure to hold $1.1550 triggered a cascade of sell orders. XRP dipped below $1.150 and $1.1420, effectively breaking the previous support structure and inviting further short-term selling.
- Current Status: As of the latest market data, the asset is oscillating near the $1.10 support zone, attempting to find a floor while struggling against the overhead resistance created by the 100-hour SMA and the aforementioned bearish trend line.
Supporting Data: Technical Indicators and Market Dynamics
A deeper dive into the technical indicators confirms the bearish narrative currently dominating the XRP/USD pair.
The MACD (Moving Average Convergence Divergence)
The hourly MACD for XRP/USD is currently losing pace within the bearish zone. This suggests that the selling momentum, while perhaps not accelerating, remains consistent. A lack of a "bullish cross" in the immediate future indicates that buyers are currently unable to regain control of the price action.
The Relative Strength Index (RSI)
The RSI, a critical tool for gauging overbought or oversold conditions, has dipped below the 50-level on the hourly chart. This shift confirms that the market momentum has tilted toward the downside. Traders often view an RSI below 50 as a signal that the asset is experiencing downward pressure, and until it crosses back above this neutral threshold, the bears are likely to maintain their grip.

Fibonacci Retracement Analysis
The price is currently hovering around the 76.4% Fibonacci retracement level of the move from $1.050 to $1.1862. This is a critical area; if the price closes below $1.080, it would effectively negate the gains from the previous rally, potentially opening the doors for a retest of the $1.050 swing low and, in extreme cases, the $1.00 psychological support level.
Implications: What Does This Mean for Investors?
The current price action has significant implications for both short-term traders and long-term holders.
- Short-Term Volatility: For day traders, the focus remains on the $1.120 and $1.1350 resistance levels. A failure to clear these levels keeps the risk of further downside intact. Conversely, a breakout above $1.1420 could provide a tactical entry point, though the overhead resistance at $1.1550 remains a primary concern.
- Support Thresholds: The $1.10 level is currently acting as a "make-or-break" point. Should the bulls fail to defend this area, the subsequent support at $1.080 becomes the next line of defense. A decisive close below $1.080 could lead to an accelerated decline toward the $1.050 and $1.020 levels.
- Market Sentiment: XRP’s correlation with Bitcoin and Ethereum continues to play a major role. If the broader crypto market continues to face pressure, it is unlikely that XRP will decouple to the upside in the near term. Investors are advised to monitor the performance of leading cryptocurrencies as a proxy for broader market health.
Expert Perspective: Navigating Volatility
Market experts emphasize that while technical analysis provides a roadmap for price movement, it must be balanced with a disciplined risk management strategy. In a volatile market, the temptation to "buy the dip" can lead to significant losses if the support levels are not confirmed.
"Technical analysis is not about predicting the future; it is about managing probabilities," notes market veteran Aayush Jindal. "When an asset is trading below its moving averages and the RSI is in bearish territory, the probability of further decline is higher than that of an immediate reversal. Prudent investors focus on waiting for clear signals of trend exhaustion before deploying capital."
Conclusion: The Road Ahead
XRP is at a crossroads. While the current bearish signals are clear, markets are inherently dynamic and subject to sudden shifts based on news, regulatory updates, or changes in liquidity. For now, the technical picture suggests that the path of least resistance is toward the downside.
Investors and traders should keep a close eye on the $1.10 support and $1.1350 resistance. A move above $1.1420 would be a necessary first step for the bulls to regain control and invalidate the current bearish sentiment. Until such a shift occurs, caution remains the watchword for all participants in the XRP market.
Disclaimer: The information provided in this article is for educational and informational purposes only. It does not constitute financial, investment, or trading advice. Cryptocurrency investments carry significant risks, and readers should conduct their own research or consult with a qualified financial advisor before making any investment decisions. Use of the information provided herein is at your own risk.
