

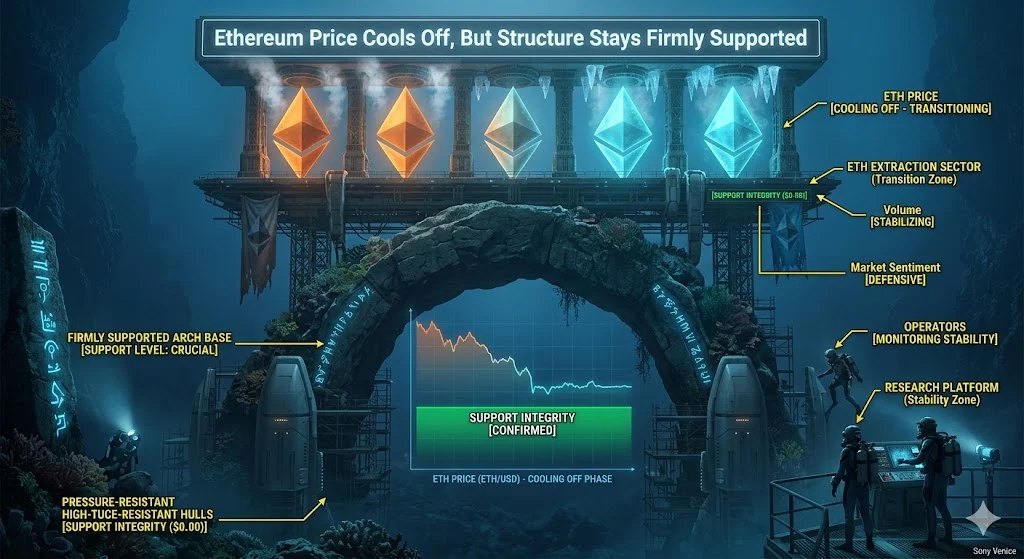
Executive Summary: Ethereum’s Renewed Momentum
Ethereum (ETH), the world’s leading smart contract platform, has demonstrated notable resilience in the current market cycle. Following a period of consolidation, the asset has successfully defended the critical $1,600 support floor, mirroring the broader market recovery observed in major assets like Bitcoin. By establishing a stable base above the $1,680 mark, Ethereum is signaling a potential shift in investor sentiment, as bulls attempt to regain control of the narrative.
As of the latest hourly trading data, Ethereum is undergoing a period of consolidation. While the asset has pulled back slightly from its local high of $1,731, the technical structure remains optimistic. Investors are now closely watching the $1,750 level, which serves as the primary gateway to further upward momentum. If the current support structures hold, analysts expect a retest of higher resistance zones, potentially setting the stage for a rally toward $1,900.
Chronology: The Road to $1,731
The recent price action for Ethereum did not occur in a vacuum. It was the result of a deliberate recovery effort initiated at the $1,603 swing low.
- The Foundation ($1,600): Ethereum found substantial buying pressure at the $1,600 psychological level. This support prevented a deeper correction and provided the necessary leverage for a recovery.
- The Breakout: Buoyed by Bitcoin’s own upward trajectory, ETH broke through initial resistance levels at $1,620 and $1,640 with significant volume.
- The Peak: Buying interest intensified as the price climbed toward $1,740, ultimately reaching an hourly peak of $1,731.
- Current Consolidation: Following the peak, the market entered a cooling-off period. The price is currently digesting these gains, maintaining its position above the 23.6% Fibonacci retracement level of the move from $1,603 to $1,731. This consolidation is considered healthy by technical analysts, as it allows for the accumulation of energy before the next leg of the rally.
Technical Analysis: Beneath the Surface
The Role of Moving Averages and Trend Lines
A critical component of Ethereum’s current stability is its position relative to the 100-hourly Simple Moving Average (SMA). Trading above this indicator suggests that the medium-term trend remains firmly in the hands of the buyers.
Furthermore, a bullish trend line has materialized on the hourly chart, offering structural support at the $1,665 mark. This level is particularly significant because it coincides with the 50% Fibonacci retracement of the latest upward move. As long as the price respects this trend line, the bullish outlook remains intact.
Indicators and Momentum
The technical indicators provide a compelling narrative for market participants:
- The Hourly MACD: The Moving Average Convergence Divergence (MACD) is currently displaying momentum within the bullish zone. This indicates that buying pressure is still exerting influence despite the minor pullback.
- The Relative Strength Index (RSI): Currently sitting above the 50-neutral zone, the RSI reflects a lack of overbought conditions, suggesting that there is still room for further upside without the immediate risk of a forced correction.
Strategic Implications: Resistance and Support Levels
The Bullish Case: Reaching for $1,900
For Ethereum to resume its climb, it must first navigate immediate resistance near $1,720 and the crucial barrier at $1,740. Clearing the $1,740 level would likely trigger a wave of buy-stop orders, potentially pushing the asset toward the $1,780 threshold.
If momentum sustains beyond $1,780, the focus shifts to $1,850. A decisive breakout above this region would clear the path for a move toward the $1,880 or even the $1,920 psychological resistance zones. Such a move would be significant, as it would represent a fundamental shift in the asset’s trading range for the quarter.
The Bearish Case: Managing the Pullback
Market participants must also account for the possibility of a downside correction. If Ethereum fails to break the $1,740 ceiling, traders may see an increase in profit-taking, leading to a retest of the $1,680 support level.
Should the price dip below the aforementioned $1,665 trend line, the support structure begins to weaken. The next line of defense sits at $1,650, followed by the $1,620 level. However, the most critical "do-or-die" level remains $1,600. A breach below this floor would likely invalidate the current bullish thesis and necessitate a re-evaluation of the short-term outlook.

Broader Market Implications and Context
Ethereum’s price performance is inextricably linked to the health of the decentralized finance (DeFi) ecosystem and the broader macro-economic climate.
The Correlation with Bitcoin
The current trend illustrates that Ethereum remains highly sensitive to Bitcoin’s performance. When Bitcoin leads, Ethereum typically follows with amplified volatility. Investors are currently watching for a "decoupling" or a "rotation" event, where capital moves from Bitcoin into ETH as the latter reaches critical technical thresholds.
Macro-economic Factors
The resilience shown by Ethereum above the $1,600 level comes at a time of uncertainty in global markets. Interest rate projections and regulatory discussions continue to influence institutional inflows. While the crypto market remains volatile, the sustained interest in Ethereum’s staking ecosystem and the ongoing reduction in circulating supply via transaction burning mechanisms (EIP-1559) continue to provide a fundamental floor for the asset’s valuation.
Expert Perspectives: What Analysts Are Watching
Market analysts often point out that the $1,750 level is not just a resistance point, but a psychological battleground. "If we see the price consolidate above $1,750 for more than 48 hours, it confirms that the market has accepted a higher valuation floor," says one market strategist.
Conversely, the "whipsaw" risk remains high. Investors are advised to utilize stop-loss orders around the $1,665 support zone, as volatility can often cause temporary dips below these trend lines before a larger move resumes.
Conclusion: Preparing for the Next Move
Ethereum stands at a pivotal junction. The setup on the hourly chart—characterized by a series of higher lows and a consistent hold above the 100-hour SMA—suggests that the bulls are currently in the driver’s seat.
However, the market is currently in a "wait-and-see" phase. The lack of a decisive push above $1,740 means that traders are exercising caution, waiting for a catalyst to drive volume higher. Whether that catalyst comes from further Bitcoin gains, positive news regarding Ethereum’s roadmap, or shifts in liquidity, remains to be seen.
For now, the focus is clear: maintain support at $1,665, clear the hurdle at $1,740, and the path to $1,850 and beyond becomes significantly clearer. Traders should keep a close watch on the MACD and RSI as they navigate these coming sessions, as these tools will likely provide the earliest signals of the next major price swing.
Disclaimer: This report is for informational purposes only and does not constitute financial advice. Cryptocurrency investments carry inherent risks. Please consult with a qualified financial advisor before making any investment decisions.
