

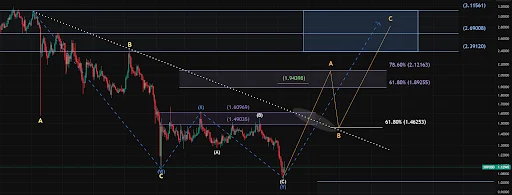
XRP is currently at a critical crossroads. After enduring a brutal selloff that saw the cryptocurrency test significant psychological support levels, market bulls are attempting to pivot from a mere relief rally to a sustained, structural recovery. Technical indicators suggest the potential for a three-part impulse wave originating from the recent lows of approximately $1.05. However, the path forward remains precarious, as the asset must successfully reclaim and hold price levels that were decimated during the recent market crash.
This analysis examines the technical architecture currently forming on XRP charts, the broader macro-economic context, and the potential outcomes that could either propel the asset toward new all-time highs or signal a deeper, more protracted consolidation.
The Anatomy of the Current Price Action
The current market sentiment surrounding XRP is defined by a tug-of-war between technical optimism and the reality of recent downward pressure. After plummeting from highs above $3.00, XRP has spent the better part of the last year locked in a complex, multi-stage corrective phase.
Understanding the W-X-Y Double Zigzag
According to technical analysis shared by market observers, including insights from the RWA_Investor community on X, the price action since last year can be categorized as a "W-X-Y double zigzag." This is a classic corrective pattern in Elliott Wave theory, characterized by three distinct movements:
- Wave W: This initial leg completed a full A-B-C decline, bottoming out in early February at a major support zone.
- Wave X: Acting as a linking wave, this phase produced a counter-rally that pushed XRP above the $1.50 threshold in mid-May. This rally, while initially promising, failed to establish sustained momentum and ultimately folded under sell-side pressure.
- Wave Y: This final leg has pushed XRP back down to the $1.12 range, where it currently struggles to establish a firm floor.
This complex structure has consumed months of price history, leading to significant fatigue among retail investors. However, analysts point out that if the $1.05 to $1.12 region holds as a "macro bottom," the technical setup for a reversal becomes significantly more compelling.
Chronology of the Recovery: A Roadmap to $3.00+
For the bulls to regain total control, the price action must follow a specific sequence. Analysts are currently mapping a three-wave A-B-C recovery structure that, if validated, could see XRP challenge the upper resistance band between $2.39 and $3.11.
The Three-Part Impulse Sequence
The projected recovery path is broken down into three distinct phases:
- Wave A (The Initial Breakout): This wave is expected to target the $2.12 region. This phase will be the most significant test of the recovery, as it requires the price to breach the critical $1.46 support/resistance trendline. Success here would confirm that the selling pressure has been exhausted.
- Wave B (The Shakeout): Following the move to $2.12, a retracement is anticipated, likely bringing the price back down to the $1.46 support level. It is vital for investors to recognize this as a "shakeout" rather than a return to a bearish trend. This phase is necessary to consolidate gains and build the liquidity required for the final push.
- Wave C (The Final Advance): This is projected to be the most powerful leg of the sequence. If Wave B holds, Wave C is expected to carry XRP into a target zone between $2.70 and $3.10.
Should XRP succeed in breaking above the $3.10 level, the technical narrative shifts entirely. At that point, the entire $1.05 to $1.12 period would be retrospectively classified as a macro bottom, setting the stage for a broader trend reversal and a potential attempt to establish new all-time highs.
Supporting Data and Technical Indicators
The validity of this bullish scenario relies heavily on volume and historical support levels. While the macro picture is complex, several indicators provide a clearer view of the current landscape.
The Significance of the $1.46 Level
The $1.46 price point serves as a pivotal psychological and technical barrier. Having previously acted as a support during the earlier stages of the 2024 cycle, its breach during the crash turned it into a formidable resistance level. Any attempt at a sustained rally must overcome this ceiling. If XRP can flip $1.46 back to support, it would essentially neutralize the bearish momentum that has dominated the asset since mid-May.
Downside Risks: The $0.75 – $0.92 Scenario
While the bullish impulse scenario is the primary focus of current analysis, professional traders are also hedging against a failure to hold current lows. If the price fails to gain momentum after the projected initial rebound and falls below the critical $1.05 support, the structural integrity of the recovery could collapse.
In such a scenario, analysts suggest that the asset could be forced into a "corrective macro wave 2," which may drag the price down to the $0.75 to $0.92 range. Interestingly, this lower band is seen by many institutional analysts as an ideal "buying opportunity," suggesting that even a deeper correction would be met with significant demand.
Implications of Current Market Dynamics
The current state of XRP has significant implications for both retail traders and long-term holders. The transition from a corrective macro structure to an impulsive bullish trend is rarely a linear process.
The Role of Institutional Demand
The "record XRP trading interest" noted in various market reports suggests that despite the price volatility, interest in the asset remains high. This suggests that the current price levels are being closely monitored by large-scale capital allocators. In the crypto markets, high trading interest at major support levels is often a precursor to a volatility-led breakout.
Navigating Market Uncertainty
For investors, the current period requires a disciplined approach to risk management. The "three-part impulse" theory is a predictive model, not a guarantee.
- The Bull Case: A break above $2.12 and a subsequent retest of $1.46 would be a strong signal that the macro-bearish cycle has concluded.
- The Bear Case: A sustained drop below $1.00 would invalidate the current "impulse" setup, necessitating a re-evaluation of the long-term cycle and likely pushing the timeframe for a new all-time high further into the future.
Conclusion: The Path Forward
XRP is currently in a "make or break" phase. The technical setup—a three-leg recovery originating from a potential macro bottom—offers a clear, albeit challenging, roadmap for a return to the $3.00 range.
The volatility seen in the last few months has been undoubtedly difficult for holders, but it has also served to clear out leveraged positions and test the strength of the asset’s floor. As the market watches the $1.12 level, the focus remains on whether buyers can muster the strength to push past the $1.46 and $2.12 hurdles.
Ultimately, whether XRP achieves a full-scale trend reversal depends on broader market sentiment and the ability of the asset to maintain its current support structure. While technical analysis provides the map, the market itself will dictate the speed and intensity of the movement. For now, the bulls have a clear objective: hold the current floor, reclaim the $1.46 level, and prepare for a potential run toward the historic highs of $3.00 and beyond.
Disclaimer: This analysis is for informational purposes only and does not constitute financial advice. Cryptocurrency investments carry inherent risks, and readers should conduct their own research or consult with a professional financial advisor before making any investment decisions.
