

The cryptocurrency market is currently witnessing a high-stakes standoff involving XRP, as bulls fight to transform a harrowing, months-long selloff into a sustainable recovery. Following a period of significant volatility that saw the asset retreat from its previous highs, technical analysts are closely monitoring a potential "three-part impulse" structure. This setup, if confirmed, could signify a fundamental shift from a corrective macro trend to a bullish momentum phase, potentially setting the stage for a retest of the $3.00 resistance level.
However, the path forward is fraught with obstacles. For the bullish thesis to hold, XRP must demonstrate the strength to reclaim key price levels that were breached during the recent market crash. As the asset hovers near critical support, the market is caught between the hope of a historic reversal and the lingering fear of a deeper, final leg of correction.
The Anatomy of the Current Price Action: A Chronological Breakdown
To understand the current technical landscape, one must look at the macro sequence that has dictated XRP’s price history over the past year.
The W-X-Y Sequence
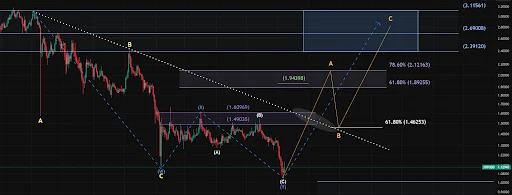
The current market sentiment is largely driven by a classic "W-X-Y" double zigzag pattern. This corrective structure has effectively consumed months of price history, keeping investors on edge as the asset struggled to find a definitive floor.
- The W Wave: This initial leg of the decline saw a complete "ABC" downward sequence. It bottomed out in early February, establishing a major structural low that analysts labeled as (C)/(W). This point served as the first significant attempt by the market to establish a foundation after the post-rally cool-off.
- The X Wave: Following the February low, a linking wave, known as Wave X, provided a much-needed relief rally. By the middle of May, XRP had successfully reclaimed the $1.50 level. Internally, this rally featured its own (X)-(A)-(B) sequence, suggesting a healthy accumulation phase. However, the momentum eventually faltered, leading to a rollover that signaled the start of the current, more grueling phase.
- The Y Wave: The final leg, Wave Y, has pushed the asset down to the $1.12 range, where it currently trades. This leg has been characterized by intense selling pressure and high trading interest, testing the resolve of long-term holders.
Technical Projections: The Road to $3.00
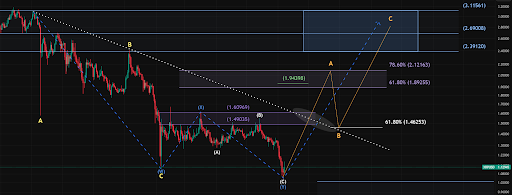
The current technical setup suggests that the (C)/(Y) wave is nearing exhaustion at the $1.12 level. If this bottom holds, analysts are projecting a three-wave "ABC" recovery structure that could propel XRP toward a target zone between $2.39 and $3.11.
Breaking Down the Impulse Phases
- Wave A (The Initial Surge): The first projected phase of the recovery aims to push XRP toward the $2.12 level. This move would represent a significant psychological victory for the bulls, as it would require breaking through the $1.46 support/resistance trendline—a critical hurdle that will serve as the first major litmus test for market strength.
- Wave B (The Shakeout): Following the surge to $2.12, the model predicts a healthy pullback back toward the $1.46 zone. In technical terms, this is not a sign of bearish failure but rather a "shakeout" phase designed to flush out weak hands and retest support before the final push.
- Wave C (The Final Expansion): This is projected to be the most aggressive phase of the sequence. If the structure remains intact, Wave C is expected to carry the price into the $2.70–$3.10 range. A successful breach of the $3.10 level would effectively confirm that the macro bottom was indeed established at $1.05, signaling the beginning of a sustained trend reversal toward new all-time highs.
Supporting Data: Why the $1.05–$1.12 Zone Matters
The significance of the $1.05 level cannot be overstated. It acts as the anchor for the entire bullish thesis. According to data shared by market analysts on social media, the alignment of historical support levels and the exhaustion of the current corrective wave suggest that the downside risk is increasingly limited compared to the potential upside.
While the bulls focus on the $3.00 target, prudent risk management necessitates an analysis of the "bearish alternative." Should XRP fail to maintain its momentum after the projected rebound—or if it is rejected at the $2.12 resistance—the asset could face a deeper correction. Many analysts have pointed to the $0.75 to $0.92 region as a critical "liquidity pocket." Should the current structure break, a visit to these levels would likely be necessary to complete a broader "Wave 2" correction before any long-term stability can be found.
Market Implications and Analyst Sentiment
The current situation with XRP is a microcosm of the broader crypto market’s struggle to find direction in a high-interest-rate environment.
The Institutional and Retail Perspective
Institutional investors are currently looking for signs of "demand-side absorption." Recent data from major exchanges indicates that while trading interest remains high, there is a clear divide between those accumulating at the $1.10 level and those selling into the relief bounces.
The "RWA Investor" analysis, which has gained significant traction on platforms like X (formerly Twitter), highlights that the current price action is not merely random volatility but a calculated move within a macro framework. This professionalization of sentiment analysis has helped many traders distinguish between "noise" and "structural shifts."
Risks to the Bullish Thesis
Despite the optimistic technical projections, several macro factors could derail the recovery:
- Regulatory Developments: As with all XRP-related price action, the looming specter of regulatory updates and legal outcomes remains a volatility catalyst. Any negative news could invalidate the technical setup instantly.
- Market-Wide Liquidity: XRP rarely moves in a vacuum. A broader downturn in Bitcoin or Ethereum would likely drag XRP below the $1.00 psychological support, regardless of the strength of its individual chart pattern.
- The "Shakeout" Trap: The projected Wave B pullback to $1.46 is a double-edged sword. While intended to be a healthy correction, if the price fails to find support there, it could trigger a cascade of liquidations, turning a potential wave into a full-scale capitulation.
Conclusion: The Path Forward
The XRP chart currently sits at a pivotal juncture. The bulls have successfully identified a roadmap that leads toward the $3.00 milestone, predicated on the completion of a three-part impulse wave. The technical evidence for a macro bottom at $1.05 is compelling, but it is not absolute.
Investors should treat the upcoming weeks as a "show-me" period. The immediate focus must be on the ability of the asset to clear the $1.46 hurdle. A successful breach of this level would provide the first concrete evidence that the bears have lost control of the narrative. Conversely, a failure to hold current levels would necessitate a re-evaluation of the macro timeline, likely pushing any significant recovery into the latter half of the year.
As always, in the volatile world of digital assets, technical patterns are projections, not guarantees. The path to $3.10 is fraught with resistance, and while the "three-part impulse" provides a clear strategy for the bulls, the market’s ultimate direction will be decided by the interplay between technical conviction and fundamental catalysts. For now, the crypto community remains in a state of watchful anticipation, waiting to see if XRP can finally break the cycle of corrective waves and reclaim its place among the market’s top performers.
