

Executive Summary: The Current State of XRP
The cryptocurrency market has witnessed a period of renewed vigor, with XRP emerging as a focal point for traders and institutional observers alike. Following a period of relative stagnation, XRP has successfully breached the $1.1650 threshold, establishing a firm footing above this pivot point. As of the latest market data, the asset is currently in a phase of consolidation, reflecting a battle between bullish momentum and technical resistance.
Market analysts are closely monitoring the $1.20 psychological barrier, a level that has historically dictated the short-term trajectory of the asset. The current price action, supported by a favorable alignment of moving averages and momentum indicators, suggests that XRP is positioning itself for a potential breakout, provided it can navigate the immediate hurdles currently capping its upward movement.
Chronology of Recent Price Action
The recent ascent of XRP did not occur in a vacuum; it mirrored broader market trends observed in leading assets like Bitcoin (BTC) and Ethereum (ETH).
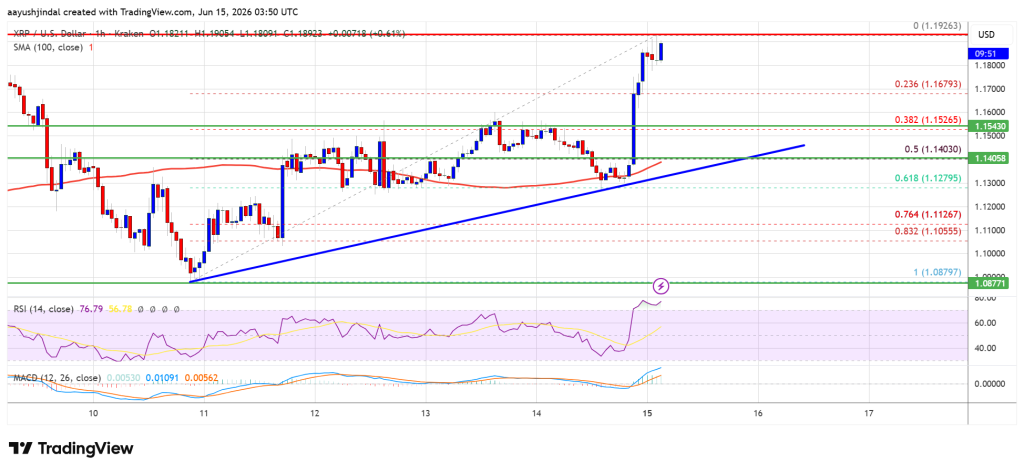
- Initial Breakout: The movement began with a clear breach of the $1.1450 and $1.1500 levels. This provided the necessary liquidity for bulls to drive the price through the critical $1.1680 resistance zone.
- The Peak and Consolidation: Momentum intensified, pushing XRP toward the $1.1880 range, ultimately carving out a local high at $1.1926. Since hitting this peak, the asset has entered a period of consolidation. By holding above the 23.6% Fibonacci retracement level—calculated from the $1.0879 swing low to the $1.1926 high—the market is exhibiting signs of healthy profit-taking rather than a systemic reversal.
- Current Positioning: XRP is currently trading comfortably above the $1.180 level and, crucially, remains above its 100-hourly Simple Moving Average (SMA). This alignment is a primary indicator of sustained short-term bullish intent.
Technical Analysis: Beneath the Surface
For traders, understanding the structural integrity of the current trend is paramount. The hourly chart for the XRP/USD pair reveals a developing bullish trend line with support situated near $1.140.
The Bulls’ Path Forward
If market participants can maintain the current pressure, the next phase of the recovery will face a series of specific resistance levels:

- Immediate Resistance: The first significant hurdle lies at $1.1920.
- The $1.20 Threshold: Clearing this psychological barrier is the primary objective for the bulls. A decisive move above $1.20 would likely trigger a secondary wave of buying, potentially testing the $1.2150 resistance.
- Extended Targets: Beyond $1.2150, analysts are keeping a close eye on the $1.2220 and $1.2250 levels, which represent the next major psychological and technical ceilings.
The Downside Scenario
Conversely, should the asset fail to sustain its momentum at the $1.20 zone, a downside correction is a distinct possibility.
- Initial Support: Should a pullback occur, the first point of stabilization is expected near $1.1680.
- Critical Retracement: A breach below the $1.1550 support level would likely invite further selling pressure, potentially dragging the price down to the $1.1400 trend line.
- Deep Corrections: In a more bearish scenario, the asset could retrace to the 50% Fibonacci level, with further support zones identified at $1.1280 and $1.1120. The ultimate floor for the current cycle is situated near $1.080.
Technical Indicators: A Snapshot of Sentiment
The health of the current trend is bolstered by two primary indicators:
- MACD (Moving Average Convergence Divergence): The hourly MACD for XRP/USD is currently gaining pace within the bullish zone, suggesting that the velocity of the upward move is still being supported by volume.
- RSI (Relative Strength Index): The RSI remains consistently above the 50 level, indicating that while the asset is experiencing upward pressure, it has not yet reached extreme "overbought" territory, allowing for further potential growth before a correction is technically mandated.
Market Implications: What This Means for Investors
The current consolidation phase of XRP is representative of a broader shift in crypto-asset valuation strategies. Investors are increasingly looking beyond simple sentiment and are applying more rigorous technical analysis to time their entries.
The Role of Institutional Interest
The stability seen above the $1.1680 level suggests that institutional accumulation may be occurring at these price points. When a digital asset holds key support levels during a consolidation phase, it often signals that "smart money" is unwilling to let the price dip significantly, preferring to absorb the supply rather than liquidate holdings.
Macroeconomic Factors
While internal technicals are robust, XRP remains sensitive to the macroeconomic climate. As the broader market reacts to central bank policies and inflationary data, the correlation between XRP and assets like Bitcoin remains high. Investors should remain cognizant that a sudden shift in Bitcoin’s price often ripples through the altcoin market, meaning that while the technicals for XRP are promising, the broader crypto-environment remains the ultimate arbiter of its short-term volatility.

Expert Commentary: Navigating Volatility
Analysis provided by Aayush Jindal, Senior Market Expert.
In the world of financial markets, volatility is not merely a risk—it is the environment in which value is discovered. The current trajectory of XRP is a classic study in market psychology. We see a transition from the accumulation phase to a breakout, now punctuated by a necessary consolidation.
The importance of the $1.20 level cannot be overstated. It acts as a gatekeeper for the next major price discovery phase. Traders must remember that in crypto, technical levels are not just lines on a chart; they are zones of liquidity where thousands of automated and manual orders congregate.
My approach to this market has always been grounded in the synergy of technology and traditional analysis. By leveraging software-driven insights alongside price action, we can better identify when a breakout is backed by real volume rather than speculative noise. As we move forward, the focus should remain on disciplined risk management. Whether the price tests the $1.2250 resistance or retreats to the $1.1120 floor, the key to long-term success lies in the ability to remain objective and reactive to the data, rather than being swayed by market emotion.
Conclusion: Preparing for the Next Move
As XRP navigates the current resistance zone, the market is at a crossroads. The technical indicators—specifically the MACD and RSI—provide a cautious but optimistic outlook. If the bulls can maintain the integrity of the $1.1680 support and successfully break the $1.20 barrier, the path toward $1.2250 becomes significantly clearer.
However, the market is inherently unpredictable. Investors are strongly advised to monitor the support levels at $1.1550 and $1.1400 closely. A breach of these levels would signal a shift in the current momentum, necessitating a more conservative stance.
As always, the volatile nature of the cryptocurrency market demands thorough research. This analysis serves as a framework for understanding current movements, but personal investment decisions should be made in the context of one’s own risk tolerance and financial objectives.
Disclaimer: The information found on NewsBTC is for educational purposes only. It does not represent the opinions of NewsBTC on whether to buy, sell or hold any investments. Investing in cryptocurrencies carries inherent risks, including the potential loss of principal. Readers are advised to conduct their own independent research and consult with a qualified financial advisor before making any investment decisions. Use the information provided on this website entirely at your own risk.
