

In the high-stakes arena of digital assets, Dogecoin (DOGE)—the world’s most prominent meme-inspired cryptocurrency—is currently navigating a precarious path. After establishing a localized base near the $0.0850 support zone, the asset has initiated a cautious recovery against the US Dollar. However, as the broader crypto market, led by giants like Bitcoin and Ethereum, undergoes its own period of consolidation, market analysts are questioning whether this upward momentum represents a sustainable breakout or merely a temporary reprieve before further downside volatility.
The Current State of Play: Key Market Mechanics
Dogecoin’s recent price action has been characterized by a tug-of-war between bullish sentiment and the weight of technical resistance. After successfully defending the $0.0850 floor, the token managed to reclaim key psychological thresholds, surging past the $0.0865 and $0.0870 resistance levels. This movement, while modest in absolute terms—representing a gain of over 2%—is significant because it signals a rejection of lower price tiers by institutional and retail participants alike.
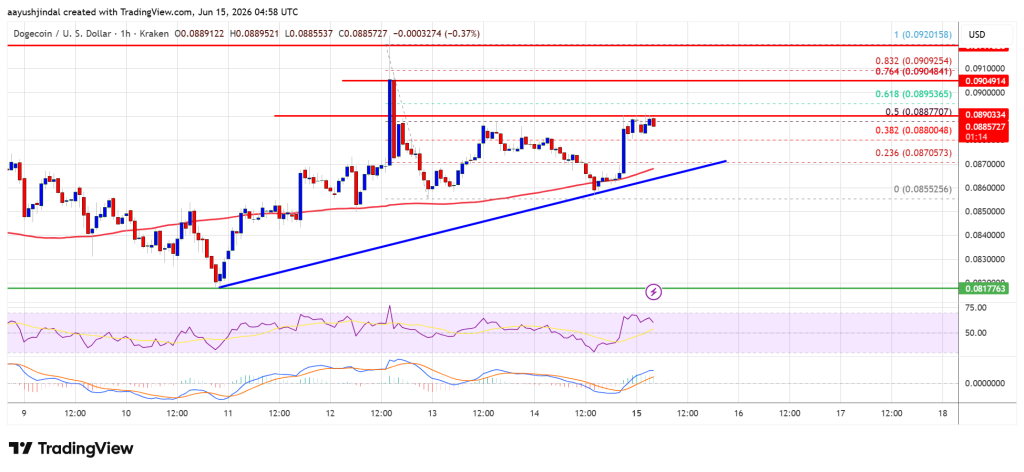
At present, DOGE is trading above the 100-hourly simple moving average (SMA), a critical indicator that typically differentiates between short-term bearish trends and potential accumulation phases. The current hourly chart reveals a bullish trend line forming with support at the $0.0870 mark. This suggests that while buyers are present, their conviction remains tightly tethered to immediate technical support levels.
Chronology of the Recent Price Action
The recent price trajectory of Dogecoin can be traced back to the swing high of $0.0920, from which the asset experienced a sharp retracement to a low of $0.0855.
- The Correction Phase: During the downward move, DOGE faced significant selling pressure, breaking below key support levels and testing the patience of long-term holders.
- The Consolidation Floor: The $0.0850 zone emerged as the critical "line in the sand." Multiple attempts to break below this level were rebuffed, establishing a strong base for a counter-offensive.
- The Initial Rebound: In the last 48 hours, the asset reclaimed the 38.2% Fibonacci retracement level of the aforementioned downward swing ($0.0920 to $0.0855). This served as the catalyst for the current, albeit fragile, upward trajectory.
- The Current Resistance Test: As of today, the price is testing the $0.0890 level, which aligns with the 50% Fibonacci retracement level. Success here is widely considered a prerequisite for any meaningful climb toward the $0.0920 resistance ceiling.
Technical Indicators and Market Sentiment
To understand the sustainability of this rally, one must look toward the underlying technical indicators that drive algorithmic and retail trading behavior.

The MACD and Momentum
The hourly Moving Average Convergence Divergence (MACD) is currently exhibiting signs of waning momentum within the bullish zone. While the signal lines remain above the zero-line, the convergence of these lines suggests that the initial buying pressure is exhausting itself. For the rally to continue, the MACD must see a fresh injection of volume to prevent a bearish crossover, which would likely trigger a wave of profit-taking.
The RSI Perspective
The Relative Strength Index (RSI) currently sits above the 50-level, indicating that buyers currently hold the upper hand. However, the RSI is not yet in "overbought" territory (above 70), which provides some room for upward movement. Nevertheless, the proximity to the neutral zone suggests that the market is in a "wait-and-see" mode, with traders hesitant to commit significant capital until a clear directional breakout is confirmed.
Supporting Data: Resistance and Support Levels
For traders and investors monitoring the Dogecoin/US Dollar (DOGE/USD) pair, the roadmap for the next 72 hours is defined by specific price markers:
-
Upside Resistance Targets:
- Immediate Resistance: $0.0890, which acts as the gateway to higher levels.
- Secondary Resistance: $0.0905, a level that has historically seen increased sell-side liquidity.
- Major Hurdle: $0.0920, the previous swing high. A daily close above this level would negate the recent bearish structure.
- Long-term Targets: If the $0.0920 level is cleared, the asset could find momentum targeting $0.0950, followed by the psychological $0.10 milestone.
-
Downside Support Levels:

- Immediate Support: $0.0870, coinciding with the current hourly trend line.
- Critical Support: $0.0855, representing the most recent swing low.
- The "Make-or-Break" Zone: $0.0850. A decisive breakdown below this level would invalidate the current bullish outlook and likely lead to a test of $0.0820 or $0.080.
The Broader Implications for the Crypto Sector
Dogecoin’s movement is rarely isolated. As an asset that often serves as a barometer for retail risk appetite, its current fragility mirrors the wider cryptocurrency landscape. The correlation between DOGE and larger-cap assets like Bitcoin remains high. If Bitcoin fails to maintain its current support, Dogecoin is highly likely to face significant downward pressure, regardless of its own internal chart patterns.
Furthermore, the influence of social media sentiment and speculative trading in the meme-coin ecosystem cannot be discounted. Unlike utility-focused tokens, Dogecoin’s price is heavily influenced by community engagement. Any shift in the macro-narrative surrounding crypto regulation or monetary policy in the United States often impacts DOGE with higher volatility than more established assets.
Expert Analysis: A Cautionary Note
Industry experts emphasize that the current "rebound" should be viewed through a lens of risk management. Aayush Jindal, a veteran in financial markets, notes that while the technical structure is currently forming a constructive base, the lack of explosive volume suggests that institutional participants are not yet fully committed to this move.
The reliance on Fibonacci retracement levels as a primary tool for navigation is a common strategy, but it is essential to remember that these are not predictive of future events—they are descriptive of past price relationships. In a market as volatile as cryptocurrency, the "fragility" mentioned in recent reports stems from the reality that the current gains are built on thin support. A sudden macroeconomic shock or a shift in investor sentiment could easily dismantle the current progress.
Conclusion: Strategic Outlook
Dogecoin is currently at a critical junction. The path of least resistance remains cautiously optimistic, provided that the $0.0870 support holds. Should the bulls manage to push the price past the $0.090 and $0.0920 resistance zones, the narrative could shift from "fragile rebound" to "early stage recovery."
However, investors should remain vigilant. The current setup is a classic example of a market attempting to find its footing after a correction. Until the asset can firmly establish itself above $0.0920, the risk of a "fake-out"—a false breakout followed by a sharp reversal—remains a distinct possibility. As always, sound risk management, including the use of stop-loss orders and a thorough understanding of one’s own risk tolerance, remains the best defense against the inherent volatility of the crypto markets.
Disclaimer: The information provided in this article is for educational and informational purposes only and does not constitute financial advice. Cryptocurrency investments are subject to high market risk. Please conduct your own research and consult with a professional financial advisor before making any investment decisions. NewsBTC and its contributors assume no responsibility for any losses incurred as a result of using the information provided herein.
