

The cryptocurrency market is currently witnessing a high-stakes standoff between XRP bears and bulls. Following a period of aggressive selling pressure that eroded significant market value, XRP investors are attempting to transition from a mere relief bounce into a sustained, multi-legged bullish impulse. While the technical landscape remains volatile, recent data suggests that the asset is forming a complex, three-part corrective structure that could serve as the bedrock for a major trend reversal.
For XRP to validate this bullish thesis, it must overcome a series of formidable technical hurdles. The current price action, oscillating around the $1.10–$1.15 range, is being closely monitored by institutional and retail traders alike, as the asset attempts to reclaim levels lost during the recent market crash.
The Mechanics of a Macro Recovery: A Chronology of Price Action
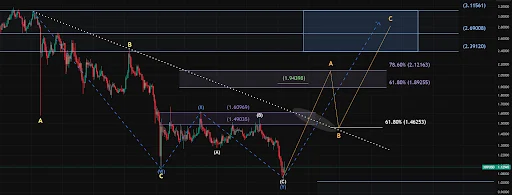
To understand the current setup, one must analyze the chronological sequence of XRP’s macro corrective phase, which has spanned the better part of the last year. Following a peak above the $3.00 threshold, XRP entered a protracted "W-X-Y" double zigzag correction.
The Wave W Decline
The sequence began with a classic "ABC" decline, which reached its nadir in early February. This bottom, labeled as (C)/(W) in technical circles, effectively purged the market of speculative leverage and established a macro baseline. This phase was defined by a steady erosion of sentiment as the broader crypto market faced regulatory headwinds and macroeconomic tightening.
The Linking Wave X
Following the February lows, a "linking wave X" emerged. This counter-rally provided a brief moment of optimism, pushing XRP prices above the $1.50 mark by mid-May. However, this recovery proved ephemeral. The internal structure of this rally—characterized by a secondary (X)-(A)-(B) sequence—eventually exhausted itself. The inability to sustain momentum above $1.50 signaled that the market was not yet prepared for a V-shaped recovery, leading to the subsequent rollover.
The Current Y Leg
The final leg of this macro sequence, the "Y" wave, has brought the price back to the $1.12 vicinity. This current stage is the most critical for investors, as it represents the "make or break" zone for the long-term bullish narrative. If this level holds, it confirms the completion of the macro corrective cycle; if it fails, the market must prepare for a deeper retest of historical support levels.
Technical Framework: Building the Three-Part Impulse
Market analysts, including insights shared by prominent figures such as RWA_Investor on the social platform X, have mapped out a potential "ABC" recovery structure that targets a significant upward trajectory.
Wave A: The Initial Push
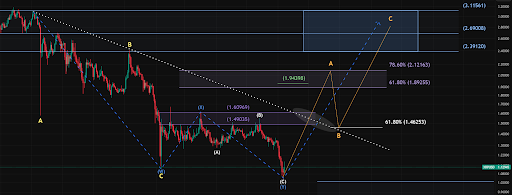
The first component of the anticipated impulse is an upward move toward the $2.12 level. This wave is expected to act as the primary test of market strength. Traders are looking for high-volume breakouts during this phase to confirm that institutional interest is returning to the asset. However, the path to $2.12 is not without resistance; the $1.46 zone—a critical support-turned-resistance trendline—stands as the first major obstacle.
Wave B: The Tactical Shakeout
Following the push to $2.12, the model suggests a retracement back toward the $1.46 support level. While this may look like a return to bearish sentiment, technical analysts characterize this as a "shakeout"—a necessary movement to clear out weak hands and consolidate support before the final leg of the sequence.
Wave C: The Macro Advance
The final and most powerful leg, Wave C, is projected to target a resistance band between $2.70 and $3.10. A successful breakout above $3.10 would be a watershed moment for XRP, suggesting that the $1.05 floor established in the current cycle is indeed the definitive macro bottom. Such a breakout would effectively invalidate the long-term corrective trend and initiate a move toward new all-time highs.
Supporting Data and Market Sentiment
The current technical setup is supported by a variety of indicators that paint a picture of an "oversold" asset poised for a correction. Trading volume patterns and on-chain flow data suggest that while demand has been weak in recent weeks, the market is approaching a state of equilibrium.
The Role of Macro Support
The $1.05 to $1.10 range is not merely a random price point; it aligns with major historical support zones. When an asset reaches these levels, the probability of a "relief bounce" increases significantly as short-sellers look to take profit and value investors enter the market. The resilience of this support level during the most recent selloff provides a glimmer of hope for the bulls.
Alternative Scenarios: The Case for a Deeper Correction
It is imperative to maintain a balanced perspective. If XRP fails to reclaim the upper resistance bands and loses momentum, the narrative shifts toward a more painful outcome. Analysts have frequently identified the $0.75 to $0.92 range as a potential "second floor." Should the market break below the $1.00 psychological barrier, it would confirm a more extended "Wave 2" correction, forcing the asset to reset its technical structure before another attempt at a bull run can occur.
Institutional Implications and Market Strategy
The struggle for control over the $1.12 level has wider implications for the broader Ripple ecosystem. For institutional players, the current price represents a potential entry point for long-term accumulation, provided the macro structure remains intact.
The "Oversold" Argument
Multiple indicators, including the Relative Strength Index (RSI) on various timeframes, suggest that XRP has been significantly oversold. Historically, when XRP hits these extreme technical readings, it precedes a period of volatility that often resolves to the upside. However, the speed of the recovery is dependent on external catalysts—namely, developments in regulatory clarity and broader market liquidity.
Strategic Considerations for Traders
- Risk Management: Investors should view the $1.46 level as a crucial inflection point. A failure to hold this level during the Wave A push would necessitate a re-evaluation of the entire bullish thesis.
- Monitoring Volume: Any move toward $2.00 must be accompanied by a significant surge in trading volume. Low-volume rallies in this price range are often indicative of "bull traps."
- The $3.00 Barrier: For the long-term investor, the $3.00 range is the ultimate target. A clean break above this would confirm that the asset has entered a new price discovery phase, leaving the 2024–2025 corrective cycle firmly in the rearview mirror.
Conclusion: The Path Ahead
XRP finds itself at a pivotal juncture. The technical setup—a complex three-part impulse structure—offers a compelling blueprint for a potential move toward $3.00 and beyond. Yet, the path is fraught with resistance, both in terms of technical price levels and market psychology.
The transition from a corrective "Y" wave to a bullish impulse is rarely a linear progression. It requires the confluence of technical strength, sustained buying pressure, and a favorable macroeconomic environment. As the market watches the $1.12 level, the message from the charts is clear: the bears have had their turn, but the bulls now have a structural opportunity to reclaim the narrative. Whether this leads to a new era of growth or a deeper consolidation remains one of the most closely watched stories in the crypto space today.
Disclaimer: This analysis is based on technical chart patterns and market data. Cryptocurrency investments carry inherent risks, and past performance is not indicative of future results. Investors should conduct their own due diligence before making financial decisions.
