

Executive Summary: The Current State of XRP
The cryptocurrency market is currently navigating a period of significant recalibration, with XRP—the native asset of the Ripple ecosystem—finding itself at a critical technical juncture. After failing to maintain momentum above the $1.150 threshold, the asset has entered a corrective phase, mirroring broader market movements seen in Bitcoin (BTC) and Ethereum (ETH). As of the latest market data, XRP is exhibiting distinct bearish signals, leaving traders and institutional analysts alike to speculate on whether the current dip is a temporary consolidation or the precursor to a more sustained downward trajectory.
The asset is currently struggling to find a stable foothold, with price action hovering near the $1.100 support level. The interplay between technical indicators, moving averages, and market sentiment suggests that the coming sessions will be pivotal in determining the asset’s medium-term viability.
Chronology of the Decline: From Momentum to Correction
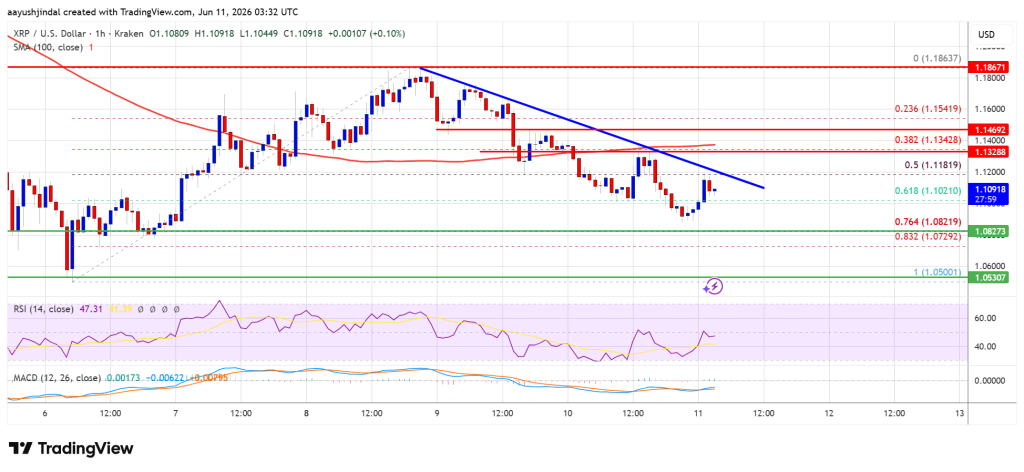
To understand the current predicament of XRP, one must look back at the recent bullish impulse that saw the price reach a swing high of approximately $1.1862. This upward movement was driven by a wave of optimism, yet the failure to consolidate above the $1.1550 resistance zone triggered a rapid technical reversal.
The Breakdown Phase
The downward shift began when XRP’s price action failed to hold above the psychological $1.150 level. In professional trading parlance, the inability to sustain support often invites a "stop-loss cascade," where automated selling triggers further downward pressure. Consequently, the asset dipped below the $1.1420 level, effectively breaching the 50% Fibonacci retracement level calculated from the $1.050 swing low to the $1.1862 high.

Current Market Sentiment
As of the latest hourly charts, XRP is currently trading below the 100-hourly Simple Moving Average (SMA). This is a classic bearish indicator, suggesting that the short-term momentum has firmly shifted in favor of the bears. The market is currently characterized by a lack of buying conviction, as participants await clearer signals from macroeconomic indicators and broader crypto-market performance.
Supporting Data: Technical Analysis and Key Metrics
A deep dive into the technical indicators reveals the extent of the current vulnerability in the XRP/USD pair.
1. Fibonacci Retracement Analysis
The 76.4% Fibonacci retracement level, which sits near $1.080, has become the "line in the sand" for bulls. If the price fails to defend this level, the market could see an accelerated move toward the $1.0650 and $1.050 support zones. Conversely, a bounce from this level would require substantial volume to reclaim the $1.1350 and $1.1420 resistance levels.
2. MACD and RSI Oscillators
- Hourly MACD: The Moving Average Convergence Divergence (MACD) indicator is currently showing a loss of pace in the bearish zone. This signifies that while selling pressure exists, it may be reaching an exhaustion point. However, until a bullish crossover occurs, the path of least resistance remains to the downside.
- Hourly RSI: The Relative Strength Index (RSI) is currently oscillating below the 50-neutral mark. An RSI below 50 in a downtrend confirms that sellers are in control, though it is not yet in "oversold" territory, leaving room for further potential declines should the selling pressure persist.
3. Key Levels to Watch
- Resistance Levels: $1.120 (bearish trend line), $1.1350, $1.1420, $1.1550.
- Support Levels: $1.100, $1.080, $1.0650, $1.050, $1.020.
Industry Perspectives: The Role of Market Experts
In the volatile landscape of digital assets, expert analysis remains a cornerstone for navigating risk. Market veterans, such as analyst Aayush Jindal, have long emphasized the importance of objective technical assessment over speculative hype.

Industry experts note that XRP’s correlation with Bitcoin and Ethereum is particularly high during periods of market stress. When the "market leaders" face pressure, altcoins—even those with robust utility like XRP—rarely decouple. The current environment is one of caution; institutional investors are likely waiting for a confirmed trend reversal before re-entering positions. The integration of algorithmic trading and automated risk management systems has further intensified the speed at which these price corrections occur, making it imperative for retail traders to rely on disciplined entry and exit strategies.
Broader Implications: What Does This Mean for the Ecosystem?
The current price action of XRP carries broader implications for the Ripple ecosystem and the wider cross-border payment sector.
The Correlation Factor
If the broader crypto market continues to exhibit downward pressure, XRP’s inability to break the $1.1840 hurdle could signal a prolonged period of consolidation. However, it is essential to distinguish between price volatility and the fundamental progress of the project. While the price chart may look "red," the underlying utility of XRP in facilitating global liquidity and cross-border settlements remains a constant factor for long-term stakeholders.
Investor Strategy in a Volatile Environment
For the individual investor, the current climate presents a classic dilemma: "buy the dip" or "wait for confirmation."
- Risk Management: Investors should prioritize capital preservation. Placing stop-losses just below the major support levels ($1.050 or $1.080) is a common strategy to mitigate catastrophic loss if the bearish trend accelerates.
- Focus on Fundamentals: While technicals dominate short-term price action, long-term investors often look to project milestones. Updates regarding regulatory clarity or new institutional partnerships can act as catalysts that render technical patterns temporarily irrelevant.
- Diversification: The volatility seen in XRP is a reminder of the inherent risks in the cryptocurrency asset class. A balanced portfolio approach remains the most effective way to hedge against individual asset drawdowns.
Conclusion: The Path Forward
XRP is currently in a "prove it" phase. The bulls must reclaim the $1.1350 and $1.1420 levels to invalidate the current bearish structure. Failure to do so, particularly a confirmed close below the $1.080 support, would likely invite further selling, potentially testing the psychological $1.00 level.
As the market continues to evolve, traders must remain vigilant, utilizing both technical analysis and a clear understanding of market sentiment. Whether the market finds a bottom near $1.050 or requires a deeper correction to flush out weak hands, the coming days will provide the necessary data to determine if XRP is ready to resume its upward journey or if a period of sideways accumulation is on the horizon.
Disclaimer: The information provided in this analysis is for educational purposes only and should not be construed as financial, investment, or trading advice. Cryptocurrency investments carry a high level of risk. Always conduct your own independent research and consult with a certified financial advisor before making any investment decisions. The author and the publication assume no responsibility for any financial losses incurred based on the content provided.
