
The cryptocurrency market is currently fixated on a classic technical formation appearing on the Bitcoin (BTC) daily chart, which has ignited speculation regarding a potential shift in market momentum. As Bitcoin navigates a period of consolidation, market analysts are closely monitoring an "inverse head-and-shoulders" pattern that could serve as a catalyst for a significant recovery toward the $69,000 mark.
This analysis explores the structural integrity of this chart pattern, the macroeconomic factors influencing Bitcoin’s price action, and the critical levels that traders must watch to navigate the current volatility.
The Core Technical Setup: Understanding the Inverse Head-and-Shoulders
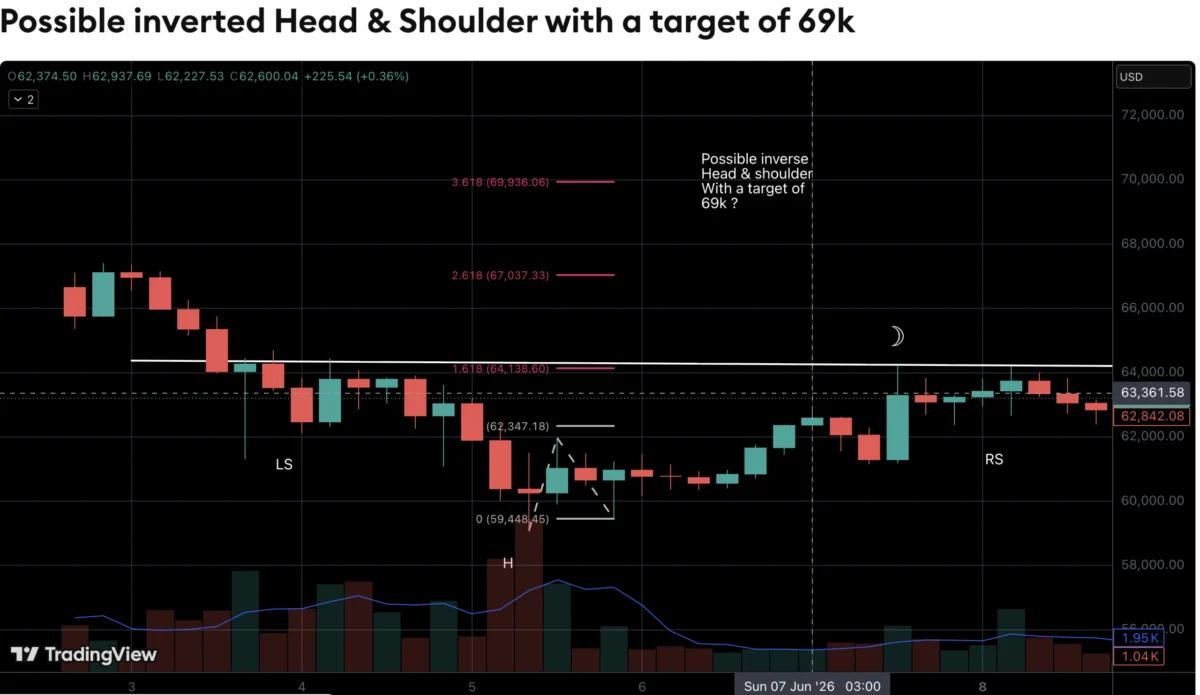
Technical analysis often relies on historical price structures to forecast future movements. Among these, the "inverse head-and-shoulders" is one of the most widely recognized signals for a bullish reversal. The pattern, identified by TradingView analyst fibsrus, consists of three distinct troughs: a left shoulder, a deeper central head, and a right shoulder.
Anatomy of the Pattern
- The Left Shoulder: Represents the initial exhaustion of the bearish trend, where sellers attempt to drive the price lower but find support.
- The Head: The lowest point of the structure, signifying a "washout" where the price dips below previous lows before buyers aggressively step in to reclaim the level.
- The Right Shoulder: A crucial component that confirms the loss of bearish momentum. By forming a higher low compared to the "head," the structure indicates that demand is starting to outweigh supply at higher price floors.
The "neckline"—a resistance level connecting the peaks between these three troughs—is the decisive trigger point. For this pattern to be considered "confirmed," Bitcoin must not only break through this resistance but also sustain a daily close above it. Until that happens, the setup remains purely speculative.
Chronology of Market Sentiment: From Bearish Pressure to Hopeful Consolidation
To understand why this pattern is garnering so much attention, one must look at the recent timeline of Bitcoin’s price performance.
Phase 1: The Descent (Pre-Pattern)
Following previous peaks, Bitcoin experienced a sustained period of downward pressure, characterized by a series of lower highs and lower lows. This phase was fueled by a combination of interest rate uncertainty, regulatory scrutiny, and a general cooling of risk-on assets in the global markets.
Phase 2: Building the Foundation (The "Head")
During the most recent volatility, Bitcoin tested critical support levels. The formation of the "head" at the lowest point of the chart served as a stress test for the bulls. The subsequent bounce proved that despite macro headwinds, there is significant "buy-the-dip" interest waiting in the wings to prevent a deeper capitulation.
Phase 3: The Current Consolidation (The "Right Shoulder")
Bitcoin is currently oscillating within the right shoulder of the pattern. This is a period of "coiling," where the market is effectively waiting for a definitive catalyst. Traders are observing a contraction in volatility, which often precedes a sharp, directional breakout.
Supporting Data: Defining the Key Levels
The strength of any technical analysis lies in its risk management parameters. The fibsrus analysis provides a clear roadmap for traders, stripping away the emotional noise often associated with crypto trading.
1. The Upside Target: $69,000
The $69,000 target is derived from the "measured move" technique, which calculates the vertical distance from the head to the neckline and projects that distance upward from the breakout point. Achieving this level would represent a return to significant psychological resistance, marking a successful recovery from the recent downtrend.
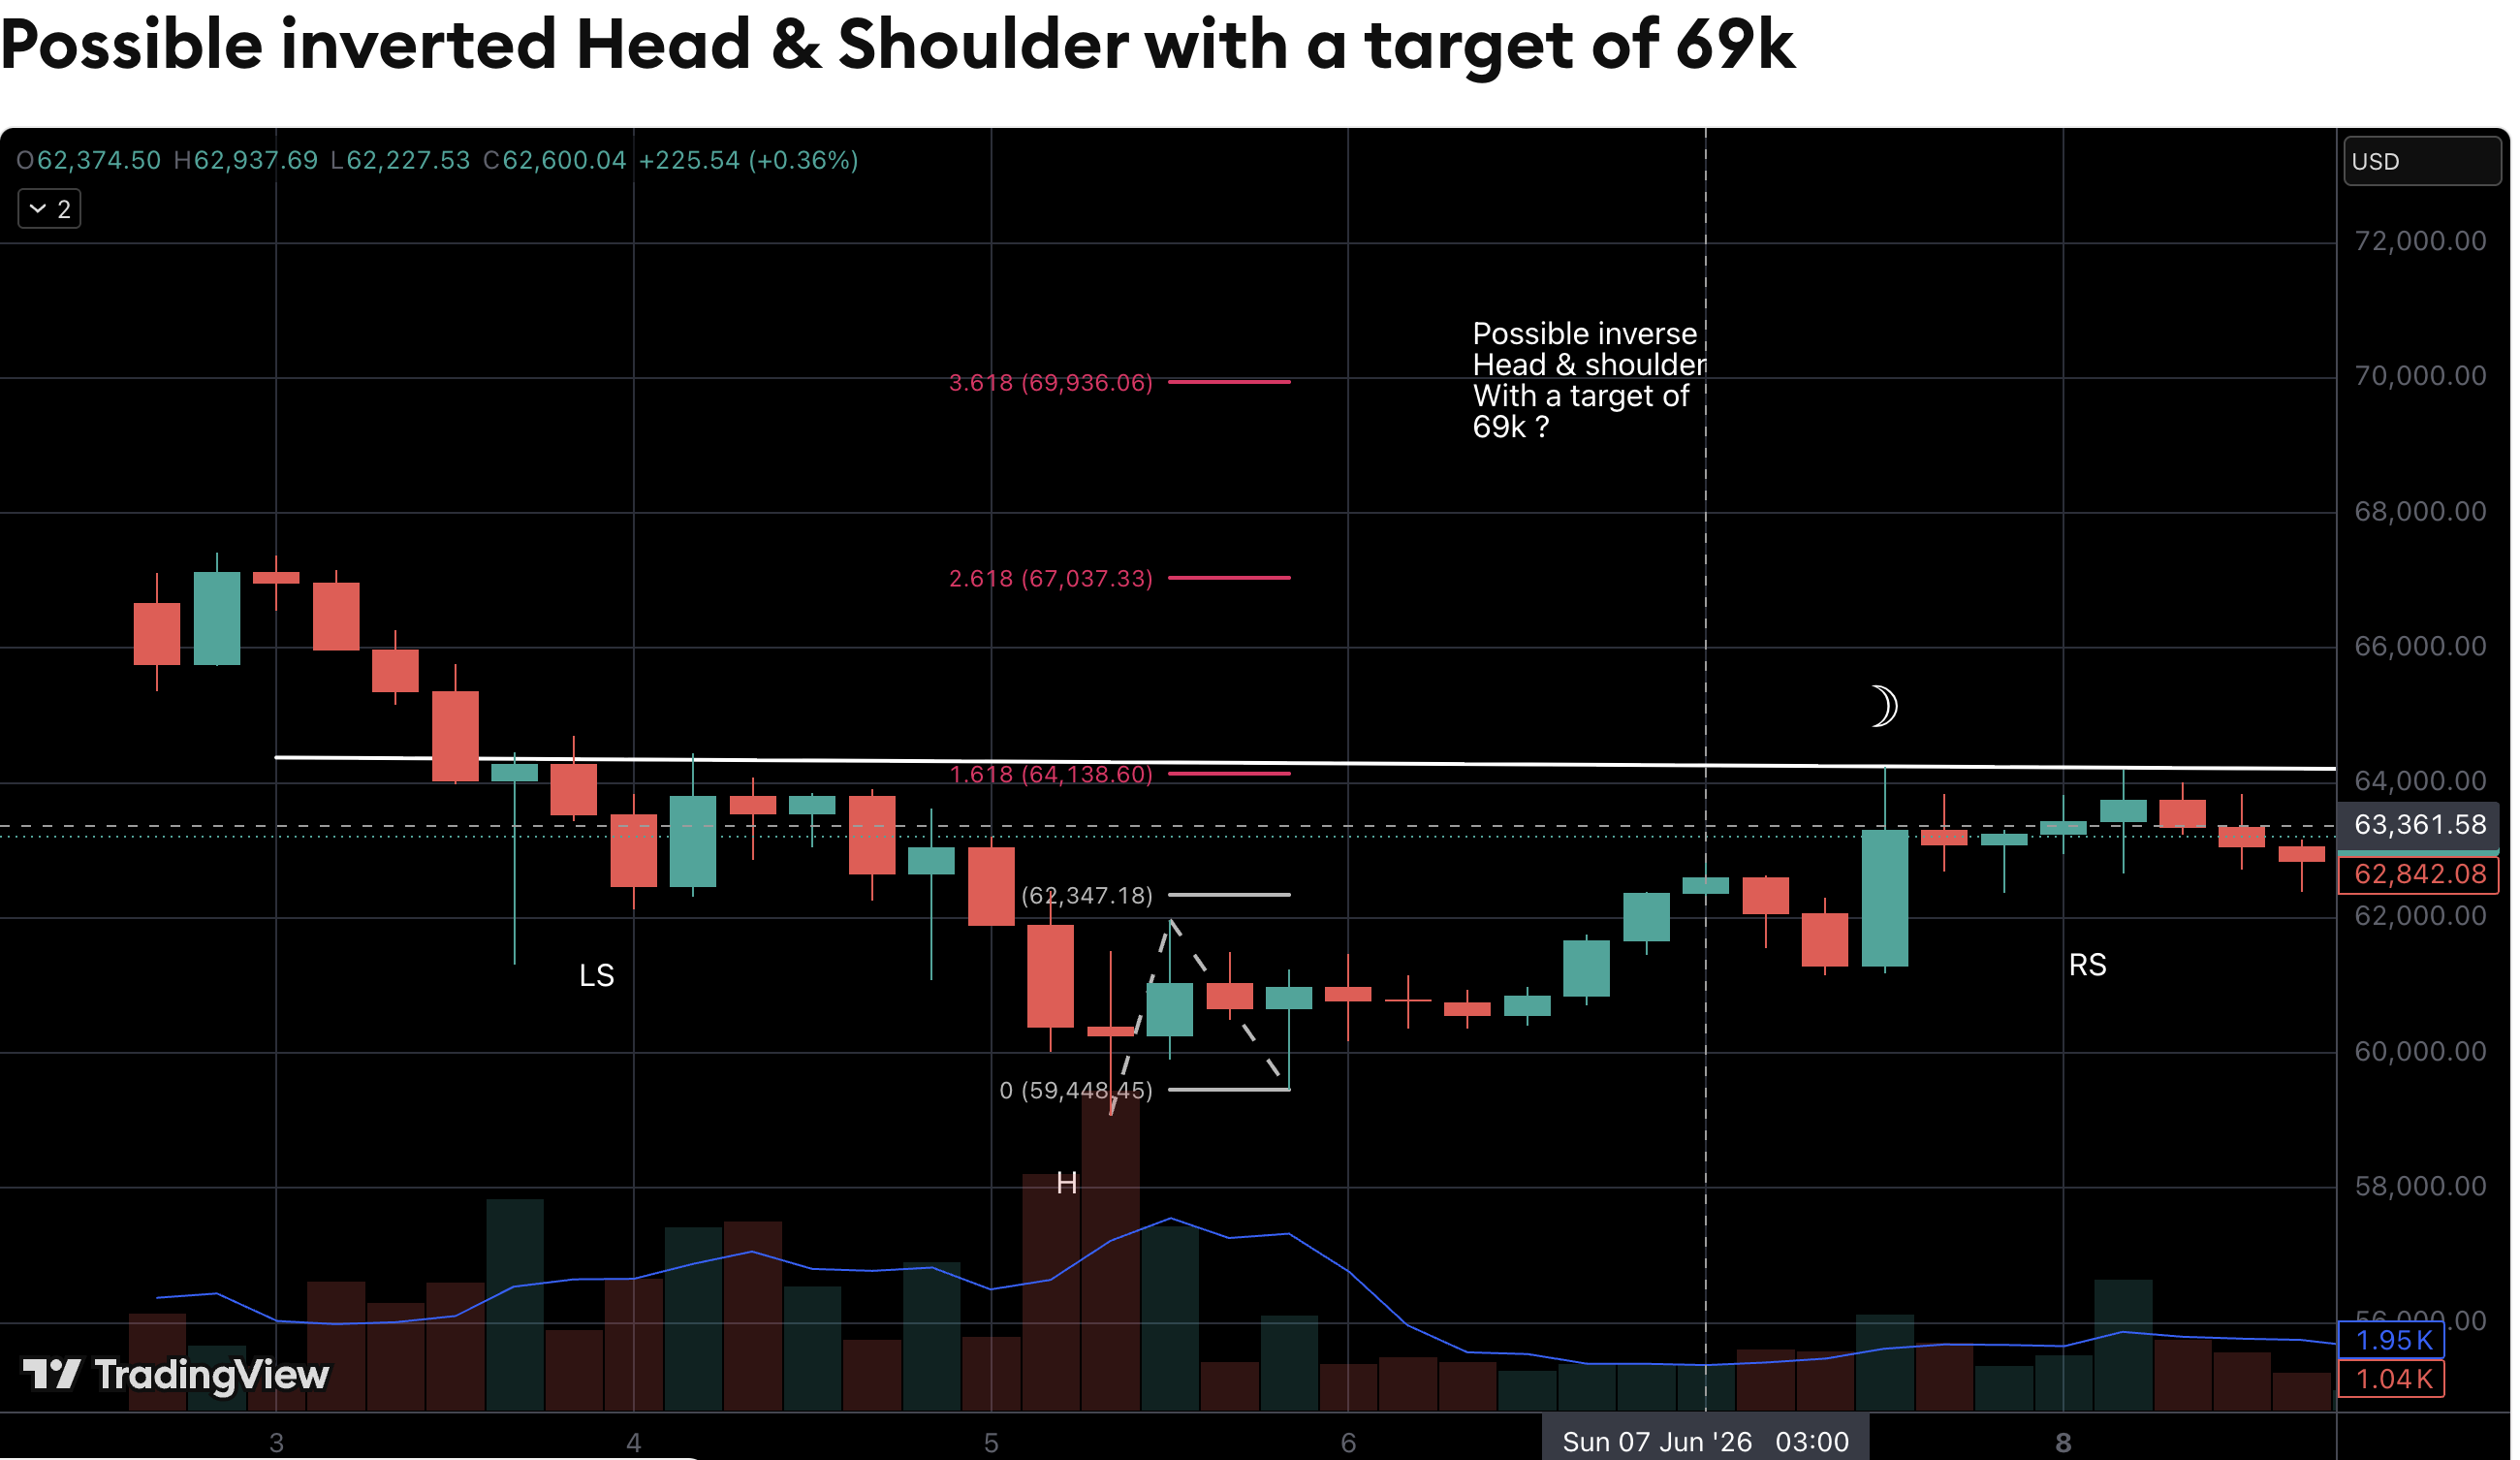
2. The Invalidation Level: $59,400
The invalidation point—the low of the right shoulder—is arguably more important than the target itself. Should Bitcoin drop below $59,400, the "higher low" structure is compromised. A breakdown here would suggest that the sellers have regained control and the bullish reversal is invalidated, likely triggering a move toward lower support zones.
The Macroeconomic Context: Why Patterns Can Fail
While the inverse head-and-shoulders is a robust technical signal, it does not exist in a vacuum. The effectiveness of this chart pattern is intrinsically linked to the broader macroeconomic environment.
Liquidity and Global Markets
Bitcoin is increasingly viewed as a high-beta asset, meaning it tends to amplify the movements of the broader stock market, particularly the tech-heavy Nasdaq. If central banks maintain a "higher for longer" interest rate stance or if liquidity drains from the global system, the bullish chart pattern may struggle to find the volume required to break the neckline.
The Role of Market Breadth
Market breadth refers to the number of participants active in the move. For a breakout to be legitimate, it should be accompanied by a spike in trading volume. A "breakout" on low volume is often a "bull trap"—a deceptive move designed to lure in retail buyers before the price reverses sharply to the downside.
The "False Breakout" Risk
The most common pitfall for traders in this setup is jumping the gun. A brief wick above the neckline, followed by a rapid rejection, is a classic feature of volatile markets. This is why seasoned experts advise waiting for a confirmed daily close above the neckline, and in some cases, a retest of the neckline as new support, before establishing a long position.
Expert Implications: A Strategic Framework
What does this setup mean for the average investor? Rather than viewing the $69,000 target as a guaranteed outcome, it is more productive to view the pattern as a strategic framework.
- Defining Risk: By using the $59,400 level as a stop-loss, traders can define their maximum risk per trade. This allows for disciplined position sizing, which is the cornerstone of long-term success in the crypto market.
- Confirmation Over Prediction: The market rewards those who react to price action rather than those who try to predict it. The neckline serves as a "confirmation gate." If the gate is breached, the probability of an upward move increases; if it holds, the current range-bound behavior persists.
- The Psychological Shift: Even if the price does not immediately reach $69,000, the successful formation of a right shoulder demonstrates that the market is beginning to build a base. This shift in sentiment is often the precursor to a larger market cycle change.
Conclusion: The Path Forward
The Bitcoin chart, as interpreted through the lens of the inverse head-and-shoulders pattern, offers a glimmer of optimism for a market that has been searching for direction. With a target of $69,000 and a clear invalidation point at $59,400, the setup provides a binary outcome that helps remove the ambiguity of the current price action.
However, caution remains the watchword. As with all technical patterns, the inverse head-and-shoulders is a tool for probability, not a crystal ball. Investors should remain vigilant, keeping a close eye on trading volume and macro-economic announcements that could override technical signals.
Ultimately, whether the pattern plays out as predicted or fails due to shifting market dynamics, it serves as a valuable exercise in risk management. By respecting the defined levels, traders can navigate the volatility of the cryptocurrency space with a clearer sense of purpose, regardless of the ultimate direction of the price.
Disclaimer: This article is for informational purposes only and does not constitute financial advice. Cryptocurrency investments carry high risks. Always conduct your own research and consult with a professional financial advisor before making investment decisions.
