

Executive Summary: The Current State of Solana
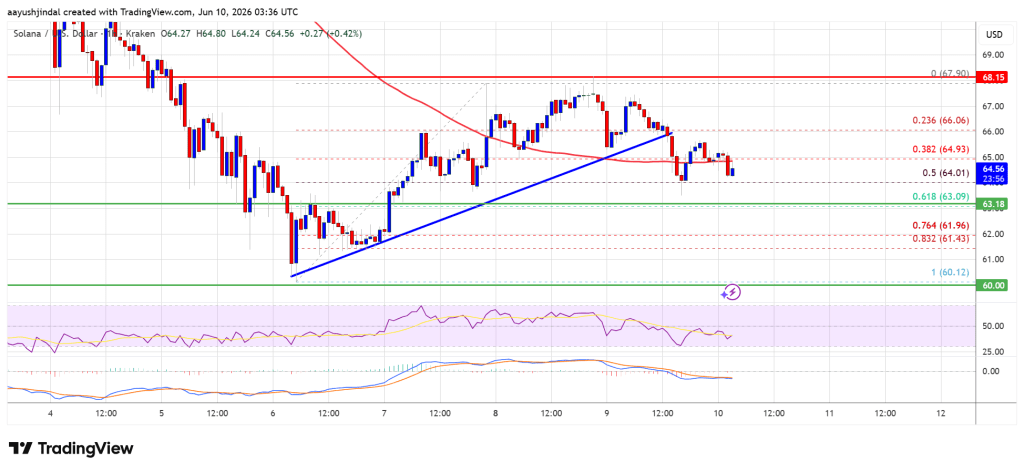
Solana (SOL), once a high-flying asset in the decentralized finance (DeFi) ecosystem, is currently navigating a challenging period of price consolidation and downward correction. Following a failed attempt to maintain the critical $67 resistance level, the cryptocurrency has witnessed a steady decline, mirroring broader bearish sentiments observed in major assets like Bitcoin and Ethereum. As of the latest market data, SOL is struggling to find a stable footing, with technical indicators suggesting that the short-term outlook remains cautious. Investors and market participants are closely monitoring the $63 support zone as the primary threshold to prevent a deeper slide toward lower psychological levels.
Chronology of the Recent Correction
The downward trajectory of Solana did not occur in a vacuum; it is the culmination of several days of oscillating market sentiment.
The Peak and Subsequent Rejection
Early in the week, Solana demonstrated relative strength, climbing to a swing high of $67.90. This upward momentum, however, proved unsustainable. Market analysts noted a failure to hold the $67 threshold, a level that had previously served as a pivot point for bullish traders. As the resistance solidified, profit-taking became widespread, leading to a swift breakdown.
The Breakdown Phase
The correction intensified as the price dipped below the $66 and $65 psychological supports. Crucially, the hourly chart revealed a breach of a significant bullish trend line that had previously propped up the price. This technical failure was exacerbated by a move below the 50% Fibonacci retracement level, which tracked the upward wave from the $60.12 swing low to the $67.90 high.
Current Market Positioning
At present, Solana is trading below the $65 mark and remains situated under the 100-hourly simple moving average. This positioning indicates that the bears are currently in control of the short-term narrative. The market is now in a "wait-and-see" phase, where the $63.20 support level is being tested as the floor for current trading activity.

Supporting Data: Technical Indicators and Market Dynamics
To understand the underlying health of the asset, we must look at the quantitative metrics that define the current price action.
MACD and Momentum
The Moving Average Convergence Divergence (MACD) for the SOL/USD pair is currently gaining momentum within the bearish zone. A widening gap in the MACD lines suggests that selling pressure is not yet exhausted, and the lack of a bullish crossover indicates that momentum remains firmly with the sellers.
Relative Strength Index (RSI)
The Relative Strength Index (RSI), a key gauge for overbought or oversold conditions, has slipped below the neutral 50 level. A reading below 50 in the hourly timeframe confirms that the bearish trend is active and that there is sufficient room for further downside before the asset could be considered "oversold."
Fibonacci Retracement Analysis
The price action is currently hovering near the 61.8% Fibonacci retracement level of the most recent upward swing. This is a critical juncture. If the price fails to defend this level, technical analysts often interpret the breach as a signal for a more significant trend reversal, potentially leading toward the $60 support zone or lower.
Implications: Where Does Solana Go From Here?
The current market structure presents two distinct paths for Solana in the coming days.

The Bullish Case: Reclaiming Resistance
For the bulls to regain control, a successful breach and daily close above the $67.20 resistance zone is non-negotiable. Should the market witness a surge in buying volume, the next key resistance lies at $68. Clearing this hurdle would effectively invalidate the current short-term bearish structure and could pave the way for a retest of the $70 psychological barrier. Such a move would require a broader recovery in the crypto sector, likely triggered by a positive catalyst in Bitcoin’s performance.
The Bearish Case: Risk of Further Downside
Conversely, if the $63.10 support fails to hold, the path of least resistance will shift further downward. A breach of the $62.20 support level would likely accelerate selling, with the $60.00 zone serving as the final line of defense. Should the price close below $60, market participants should prepare for a potential test of the $55 support level, representing a significant correction from the recent highs.
Industry Expert Insight: The Role of Volatility
Aayush Jindal, a senior market expert with over 15 years of experience in Forex and cryptocurrency, notes that while the current correction is severe, it is not uncommon for high-beta assets like Solana to experience such volatility.
"The interplay between technical support levels and market sentiment is at an all-time high," says Jindal. "When we look at the confluence of the 100-hourly SMA and the recent Fibonacci levels, we are looking at a classic battle between bulls and bears. The key for investors is not to panic, but to observe whether the support at $63 holds under pressure. In the world of crypto, volatility is the tax you pay for potential long-term growth, but that doesn’t mean you shouldn’t manage your risk carefully during these downturns."
Institutional and Market Perspectives
The broader cryptocurrency market remains sensitive to macroeconomic factors, including interest rate decisions and regulatory developments. Solana, as a primary layer-one competitor to Ethereum, often sees its price action influenced by its own network health. Recent concerns regarding network stability or throughput—though not directly cited as the primary cause for this specific price dip—often act as underlying weights on investor sentiment.
Furthermore, the "Ad Disclaimer" notice in industry reports serves as a reminder that these analyses are for informational purposes. Investors are cautioned that technical analysis provides a map of probability, not a guarantee of outcome. The current decline in SOL is a stark reminder of the necessity of stop-loss orders and portfolio diversification.
Conclusion: Strategic Considerations for Traders
As we navigate this period of volatility, the following takeaways remain critical:
- Monitor the $63.10 level: This is the immediate threshold. A bounce here could signal a stabilization period.
- Watch the Resistance: The $66 and $67.20 levels are the primary targets for any recovery attempt. Until these are reclaimed, the outlook remains bearish.
- Risk Management: With the MACD and RSI signaling bearish momentum, aggressive long positions may carry elevated risk.
- Broader Context: Keep a watchful eye on Bitcoin. Historically, when Bitcoin stumbles near key resistance levels (like the $64k mark), altcoins like Solana tend to amplify the downward movement.
Solana remains a robust technological project, but its price action in the coming hours and days will be dictated by its ability to hold current support. Whether this is a simple "buy-the-dip" opportunity or the start of a more sustained correction will be answered by how the market reacts to the $62-$63 support cluster.
Disclaimer: The information contained in this article is for educational and informational purposes only. It does not constitute financial, investment, or trading advice. Investing in cryptocurrencies involves substantial risk of loss. Always conduct your own thorough research and consult with a qualified financial advisor before making any investment decisions.
