
The cryptocurrency market is currently witnessing a period of intense scrutiny and anticipation as XRP, the native asset of the XRP Ledger, attempts to solidify its position above the $1.1650 support level. After a period of volatile trading, the digital asset has embarked on a steady upward trajectory, mirroring the broader recovery trends observed in major cryptocurrencies like Bitcoin and Ethereum. As of the latest market sessions, XRP is consolidating its recent gains, with traders and analysts closely monitoring the $1.20 psychological barrier—a critical zone that could dictate the asset’s medium-term momentum.
Main Facts: The Current State of XRP
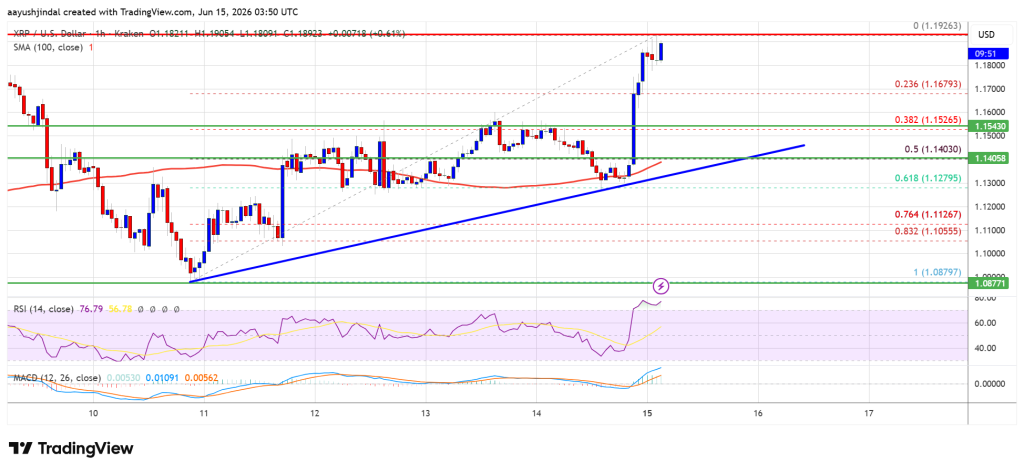
XRP’s recent performance has been characterized by a breakout from previous consolidation ranges. Having successfully cleared the initial resistance at $1.1450 and $1.1500, the asset gained significant upward momentum, pushing past the $1.1680 resistance level.
Market data indicates that the bullish pressure was sufficient to drive the price toward a local high of $1.1926. Currently, the price is trading above the $1.180 threshold and is firmly positioned above the 100-hour Simple Moving Average (SMA). This technical placement is widely interpreted by market participants as a sign of underlying strength. Furthermore, a bullish trend line has formed on the hourly chart, providing a crucial support cushion near the $1.1400 mark, which serves as a defensive line against potential bearish pullbacks.

Chronology: The Path to the Current Rally
The recent movement of XRP did not occur in a vacuum. The rally began following a period of relative stagnation, where the asset tested lower support levels near the $1.0879 swing low.
- The Foundation ($1.08 – $1.14): XRP found significant accumulation support near the $1.0879 mark. This zone acted as the springboard for the current upward channel.
- The Breakthrough: As broader market sentiment turned positive—buoyed by Bitcoin’s reclaim of the $65,000 level—XRP leveraged the momentum to break through the $1.1500 resistance.
- The Consolidation: After hitting a peak of $1.1926, the market entered a phase of consolidation. Traders began taking profits, leading to a shallow correction that was absorbed by buyers above the 23.6% Fibonacci retracement level of the move from the $1.0879 low to the $1.1926 high.
- Current Stance: As of today, the asset is hovering in a state of equilibrium, waiting for a catalyst to challenge the $1.20 resistance zone once again.
Supporting Data and Technical Indicators
To understand the sustainability of this rally, one must look at the quantitative data provided by standard technical indicators.
- The Hourly MACD: The Moving Average Convergence Divergence (MACD) for the XRP/USD pair is currently gaining traction within the bullish territory. The widening gap between the signal line and the MACD line suggests that the buying momentum, while currently consolidating, has not yet been exhausted.
- The Relative Strength Index (RSI): Currently sitting above the 50-level, the RSI indicates that the market is neither overbought nor oversold, leaving sufficient room for a potential breakout toward the $1.20 and $1.22 levels.
- Fibonacci Retracement Levels: The price action remains supported by the 23.6% retracement level. However, should the market experience a deeper correction, the 50% retracement level—which aligns closely with the $1.1400 support and the bullish trend line—becomes the ultimate line of defense for the bulls.
Implications for Investors
The primary implication of the current price action is that $1.20 has transitioned into a "make-or-break" level. A successful, sustained close above this psychological barrier would likely trigger a wave of FOMO (Fear Of Missing Out) buying, potentially pushing the asset toward the $1.2150 and $1.2220 resistance levels. If the momentum remains strong, the next major hurdle for institutional bulls is located near $1.2250.
Conversely, a failure to clear the $1.20 zone carries significant risks. If the price fails to sustain its position above $1.1680, the market may look to retest the $1.1550 support. A breach of this level would likely lead to a deeper retracement toward the $1.1280, and potentially as low as $1.0800. For investors, the current environment necessitates a disciplined approach, focusing on risk management rather than speculative over-leveraging.
Institutional Perspective and Market Sentiment
While technical analysis provides the "what," market context provides the "why." XRP’s performance is often tied to developments surrounding Ripple Labs and the broader regulatory climate in the United States and abroad. Analysts note that as Ripple continues to expand its cross-border payment solutions, the utility-driven demand for XRP remains a constant undercurrent.
Senior market experts suggest that the current consolidation phase is healthy. It allows the market to "digest" the rapid gains made earlier in the week, preventing an over-extended rally that would be susceptible to a sharp, liquidity-driven crash. The presence of institutional interest, indicated by the steady volume maintained during the consolidation phase, suggests that large-scale participants are not yet looking to exit their positions, which provides a level of stability that retail traders often lack.
Strategic Outlook: Watching the $1.20 Threshold
Looking forward, the volatility surrounding the $1.20 mark is expected to increase as the asset approaches this level. Market participants should look for:
- Volume Confirmation: A breakout above $1.20 must be accompanied by high trading volume to be considered a "true" breakout. Low-volume surges are often traps that lead to quick reversals.
- External Market Correlation: Given that XRP often tracks the performance of Bitcoin, any sudden volatility in the BTC/USD pair will likely dictate the direction of XRP, regardless of its own internal technical structure.
- Support Integrity: If the $1.1400 trend line support is broken on high volume, the bullish thesis for the current cycle may be invalidated, requiring a re-evaluation of the asset’s short-term targets.
In conclusion, XRP is currently in a high-stakes transition period. While the technical indicators are leaning bullish, the market is approaching a resistance ceiling that has historically proven difficult to break. Investors are encouraged to monitor the $1.1680 and $1.1920 levels closely, as these will act as the primary guides for price action in the coming sessions.
Disclaimer
The information provided in this article is for educational purposes only and does not constitute financial, investment, or trading advice. Cryptocurrency investments carry inherent risks, including the total loss of capital. Market conditions are subject to rapid change, and past performance is not indicative of future results. Readers are strongly advised to conduct their own thorough research and consult with a professional financial advisor before making any investment decisions. The publisher assumes no responsibility for any financial losses incurred based on the information provided herein.
