
Executive Summary: The Current State of XRP
XRP, the native digital asset of the Ripple ecosystem, has recently exhibited a notable recovery, reclaiming key psychological levels and signaling a shift in momentum. After an extended period of relative stagnation, the asset successfully broke through the $1.1650 resistance barrier, triggering a fresh wave of bullish sentiment. As of the latest market sessions, XRP is currently in a phase of consolidation, trading comfortably above the $1.180 threshold.
Market observers are now closely monitoring the $1.20 zone, which represents a critical inflection point for the cryptocurrency. A successful breach of this resistance could act as a catalyst for a sustained rally toward the $1.25 range, whereas failure to hold current support levels may invite a technical pullback. This analysis delves into the structural dynamics of XRP’s recent price action, the technical indicators guiding short-term expectations, and the broader implications for investors.
Chronology of the Recent Rally
The recent upward trajectory of XRP did not occur in a vacuum; it mirrored the broader positive sentiment seen across the crypto-asset landscape, including Bitcoin and Ethereum.
The Breakout Phase
The movement began in earnest when XRP managed to clear the $1.1450 and $1.1500 resistance levels. This breakout was characterized by increased trading volume, suggesting institutional or whale-led interest rather than mere retail speculation. As the price climbed, it successfully invalidated several bearish trend lines that had suppressed growth throughout the previous quarter.
Reaching the $1.19 Peak
Following the initial breakout, bullish pressure intensified, pushing the price to a local high of $1.1926. This move effectively tested the strength of sellers waiting at the $1.19 resistance level. The subsequent consolidation phase, currently unfolding, reflects a healthy re-accumulation period where the market determines whether the current price floor is sufficient to support a further push toward the $1.20 milestone.

Supporting Data and Technical Indicators
To understand the sustainability of this rally, one must examine the underlying technical architecture of the XRP/USD pair on the hourly charts.
Moving Averages and Trend Lines
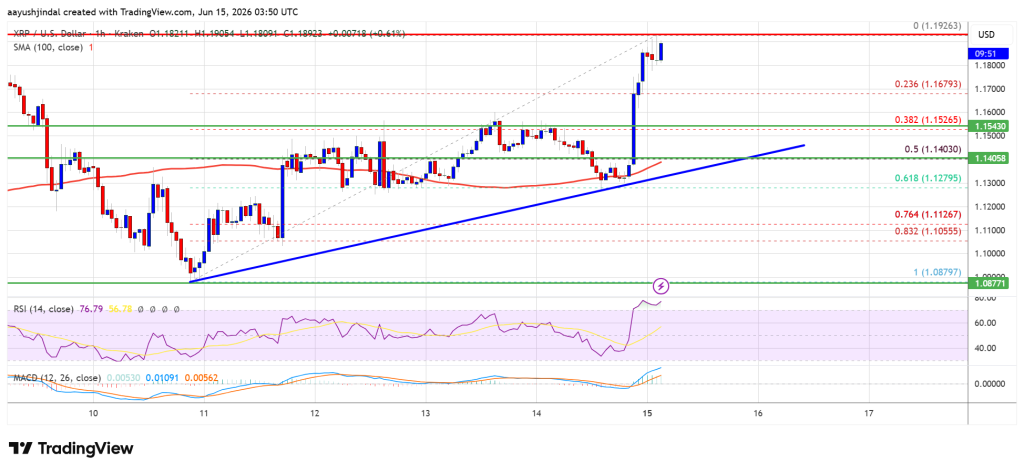
XRP is currently trading above its 100-hourly Simple Moving Average (SMA), a traditional indicator of bullish trend continuity. Furthermore, a bullish trend line has formed on the hourly chart, providing structural support near the $1.140 mark. This trend line serves as the "line in the sand" for bulls; as long as the price maintains its position above this level, the medium-term uptrend remains intact.
Fib Retracement Levels
Analyzing the move from the $1.0879 swing low to the $1.1926 high, the current consolidation is occurring above the 23.6% Fibonacci retracement level. This is a positive sign, indicating that the pullback from the recent high has been shallow. A deeper correction would only be signaled if the price were to dip toward the 50% retracement level, located near $1.140.
Oscillators: MACD and RSI
- Hourly MACD: The Moving Average Convergence Divergence (MACD) is currently gaining momentum in the bullish zone. The widening gap between the signal line and the MACD line suggests that buying pressure is still sufficient to keep the asset afloat.
- Hourly RSI: The Relative Strength Index (RSI) is holding firmly above the 50 level. While it is not yet in overbought territory (above 70), the positioning suggests that there is still "room to run" before the asset becomes statistically overextended.
Strategic Implications: Resistance and Support
For traders and long-term holders alike, identifying key levels is paramount to navigating the current volatility.
The Path to $1.20 and Beyond
If the bulls manage to sustain momentum, the immediate hurdles are as follows:
- Immediate Resistance: The $1.1920 level is the first point of contention.
- The Major Barrier: $1.1950 serves as the gateway to the $1.20 psychological level.
- Upside Targets: Should $1.20 be flipped to support, we anticipate a test of the $1.2150 resistance, followed by a potential climb toward $1.2220. The ultimate short-term ceiling is currently pegged near $1.2250, where profit-taking is likely to accelerate.
The Downside Scenario
Conversely, should the market face a rejection at $1.20, traders should be prepared for a corrective phase:
- First Level of Support: $1.1680.
- Key Support: $1.1550. A break below this level would likely trigger a cascade toward the $1.140 trend line.
- Major Structural Support: Should the $1.140 support fail, the price could revisit the $1.1280 or even the $1.1120 levels. The ultimate "floor" in this current cycle is widely considered to be $1.080.
Market Sentiment and External Factors
The current behavior of XRP is reflective of a market that is cautiously optimistic. While XRP has historically been tethered to the performance of Bitcoin, its recent independent price action suggests that developments within the Ripple ecosystem—or rumors thereof—may be providing an idiosyncratic boost.
Institutional Interest
The role of financial institutions in the XRP market cannot be overstated. As global payment networks continue to explore the utility of the XRP Ledger (XRPL), the asset’s utility value is being decoupled from pure speculation. When technical charts show a breakout like the one currently being observed, it often coincides with an increase in wallet activity among larger institutional players.
Regulatory Landscape
While not directly addressed in the daily price action, the regulatory clarity surrounding Ripple Labs continues to be a "silent" driver of price. Any positive developments regarding the legal status of XRP generally result in immediate, high-volume buying, whereas prolonged silence or negative legal developments often lead to sharp, localized corrections. Investors are advised to remain vigilant regarding news cycles that could override technical indicators.
Conclusion: A Critical Juncture
XRP stands at a decisive moment. The technical setup—characterized by a position above the 100-hour SMA and a healthy RSI—favors the bulls. However, the market remains fragile, and the $1.20 resistance level is a significant psychological hurdle that has historically proven difficult to clear on the first attempt.
Investors should focus on the integrity of the $1.1680 support level. If the price can maintain its current consolidation range without slipping into the lower $1.1500s, the probability of a successful breakout toward $1.22 increases substantially. As always, the cryptocurrency market is subject to sudden shifts in momentum driven by liquidity events and global macro factors. Traders are encouraged to utilize stop-loss orders and maintain a diversified approach to risk management as the asset approaches this critical juncture.
Disclaimer: The information provided in this analysis is intended for educational purposes only and does not constitute financial, investment, or trading advice. Cryptocurrencies are highly volatile assets; investing in them carries significant risk, including the total loss of capital. NewsBTC and its contributors do not provide recommendations on whether to buy, sell, or hold any specific asset. You are strongly encouraged to conduct your own comprehensive research and consult with a certified financial advisor before making any investment decisions. Any actions taken based on the information provided are at your own risk.
