
In the fast-paced and often unforgiving world of digital assets, XRP, the native token of the Ripple network, is currently navigating a period of heightened volatility. Following a failed attempt to maintain momentum above the $1.150 threshold, the asset has entered a corrective phase, signaling potential bearish sentiment in the immediate term. As traders and institutional investors alike look for signs of stabilization, the technical landscape suggests that XRP is currently fighting to maintain its footing against a prevailing tide of downward pressure.
Main Facts: The Current Market State
As of the latest market session, XRP has experienced a noticeable slide, slipping beneath the critical $1.150 support level. This movement is not isolated, as the broader cryptocurrency market, including major assets such as Bitcoin (BTC) and Ethereum (ETH), has also faced renewed downward pressure, reflecting a general risk-off sentiment among participants.
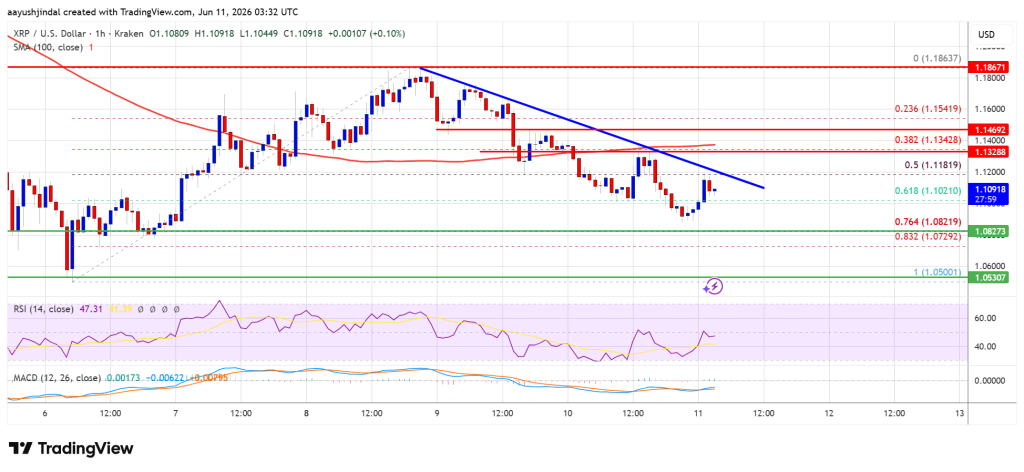
The technical setup for XRP currently shows signs of fatigue. Having failed to sustain a rally that saw the price touch highs near $1.1862, the asset has retracted to trade below the 50% Fibonacci retracement level of its most recent upward move from the $1.050 swing low. With the price currently hovering below the 100-hourly Simple Moving Average (SMA), market participants are closely monitoring whether the bulls can defend the $1.100 support zone or if a deeper correction is imminent.
Chronology: The Road to the Recent Correction
The path to the current price action was paved over the last several trading sessions. XRP had previously demonstrated resilience, climbing steadily to test the $1.1862 resistance level. This rally was fueled by speculative interest and optimistic market sentiment surrounding the broader crypto ecosystem. However, this momentum hit a wall.

- The Peak: The asset reached a local high of $1.1862, where it encountered stiff selling pressure.
- The Pivot: Unable to break through the $1.190 barrier, profit-taking triggered an initial pullback.
- The Breach: As selling volume increased, XRP broke below the key psychological levels of $1.1550 and $1.150, invalidating the short-term bullish structure.
- The Consolidation: The price attempted to stabilize near $1.120, but the formation of a bearish trend line on the hourly chart continued to act as a ceiling, preventing any significant recovery.
- Current Status: The price is now oscillating in a precarious range, with traders waiting for a decisive move—either a reclamation of the $1.1350 level or a breach below $1.080.
Supporting Technical Data
To understand the gravity of the current situation, one must look at the quantitative indicators shaping the market’s behavior. The technical analysis of the XRP/USD pair reveals a confluence of bearish factors that cannot be ignored:
- Fibonacci Retracement Levels: Having fallen below the 50% retracement level (calculated from the $1.050 to $1.1862 move), the asset is now gravitating toward the 76.4% level, which sits near the $1.080 mark. If this level fails to act as a floor, the structure of the recent uptrend will be effectively neutralized.
- The Hourly MACD: The Moving Average Convergence Divergence (MACD) indicator is currently showing a loss of momentum in the bearish zone. This suggests that the selling pressure is persistent and that buyers are currently unable to reclaim control of the trend.
- The Relative Strength Index (RSI): The RSI is presently trading below the 50 neutral mark. In technical analysis, an RSI below 50 in a downtrend is a classic indicator that the bears are in control, and the asset is lacking the buying volume necessary to force a reversal.
- Moving Averages: The fact that XRP is trading below the 100-hourly Simple Moving Average is a significant red flag. This indicator is often used as a benchmark for the medium-term trend, and its position above the current price acts as a dynamic resistance, forcing the price lower during any attempted relief rallies.
Official Context and Market Sentiment
While there is no "official" statement from Ripple Labs regarding short-term price fluctuations—as the company typically maintains a focus on long-term utility and institutional adoption—the market sentiment remains heavily influenced by external macroeconomic factors.
Analysts often point to the correlation between Ripple’s price performance and the regulatory clarity surrounding its operations. However, in the current context, the price action is largely driven by technical exhaustion and liquidity shifts. Market experts, including seasoned veterans like Aayush Jindal, have noted that the current technical configuration is characteristic of a market that has "run out of gas" after a rapid ascent, necessitating a period of "cooling off" or redistribution before a new trend can emerge.
Implications: Potential Scenarios for Traders
Looking ahead, the market is effectively split into two potential scenarios. Understanding these possibilities is essential for risk management.
The Bearish Outlook (Downside Risks)
If XRP fails to clear the immediate resistance at $1.1350, the path of least resistance is downward. The first critical support to watch is the $1.100 level. If that yields, the $1.080 level becomes the next line of defense. A decisive break and daily close below $1.080 would be a major technical failure, likely inviting further selling pressure toward $1.0650 and $1.050. In an extreme liquidity drain scenario, the price could even flirt with the $1.00 psychological support level, which would represent a significant correction from recent highs.
The Bullish Outlook (Recovery Potential)
For the bulls to regain the upper hand, XRP needs to achieve a clean breakout above the $1.1350 resistance. A move above this level would invalidate the current bearish trend line and signal that buyers are back in the market. Once $1.1350 is reclaimed, the next targets for the bulls would be $1.1420 and $1.1550. Successfully flipping these former supports back into resistance levels would pave the way for a retest of the $1.1840 high.
The Importance of Risk Management
As the market teeters between these two outcomes, it is vital to remember the inherent risks of cryptocurrency trading. Volatility is the defining characteristic of this asset class. The current technical weakness in XRP serves as a reminder that market trends can shift rapidly based on a confluence of sentiment, volume, and external market triggers.
Investors are advised to:
- Use Stop-Loss Orders: Protecting capital is paramount when volatility is high. Placing stop-losses below key support levels (such as $1.080) can mitigate significant losses.
- Monitor Volume: A breakout without corresponding high volume is often a "bull trap." Authentic trend reversals are typically accompanied by a surge in buying or selling activity.
- Diversify Analysis: While technical indicators like the RSI and MACD are helpful, they should be used in conjunction with broader market news and developments.
- Practice Due Diligence: Always conduct personal research before committing capital. The information provided here is for educational purposes and should not be construed as financial advice.
Conclusion: A Critical Juncture
XRP stands at a critical juncture. The current "red" signal on the charts reflects a market that is undergoing a necessary, if painful, correction. While the technical indicators currently lean toward the bearish side, the resilience of the $1.10 support level will be the ultimate test of the asset’s near-term strength.
Whether the asset finds a floor and begins a new period of accumulation or continues its descent toward lower support levels remains to be seen. In the meantime, market participants should remain vigilant, keep a close eye on the $1.120 and $1.1350 resistance levels, and prepare for continued volatility as the market seeks its next equilibrium.
Disclaimer: The information provided in this article is for educational purposes only and does not constitute financial, investment, or trading advice. Cryptocurrency investments are subject to high market risk. Always perform your own research and consult with a professional financial advisor before making any investment decisions. Use the information provided on this website entirely at your own risk.
