
The digital asset market is currently witnessing a period of heightened volatility, and XRP, the native cryptocurrency of the Ripple network, has found itself at a critical technical juncture. Following a failed attempt to maintain momentum above the $1.150 threshold, XRP has entered a corrective phase, mirroring the broader market struggles observed in major assets like Bitcoin and Ethereum. As the price retreats, market participants are closely monitoring key support levels to determine whether the asset is facing a temporary dip or the beginning of a more profound structural decline.
Main Facts: The Current State of the XRP Market
XRP is currently struggling to find stable footing as bearish sentiment gains traction. After failing to consolidate above the $1.1550 resistance level, the asset experienced a sharp retracement, slipping below the psychological support levels of $1.150 and $1.1420.
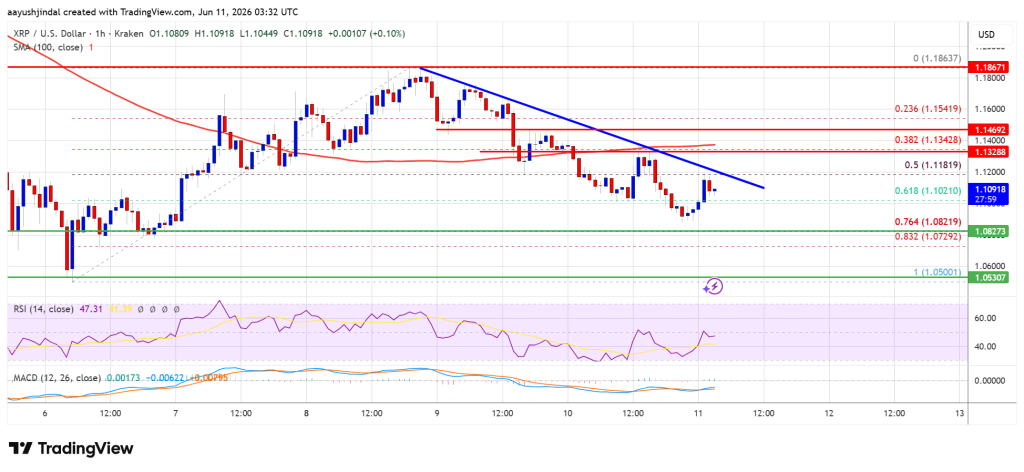
This decline is not isolated; it reflects a systemic cooling-off period across the cryptocurrency landscape. From a technical perspective, the price has dipped below the 50% Fibonacci retracement level, which was calculated based on the recent upward swing from a $1.050 low to a $1.1862 high. Currently, the price is oscillating below the 100-hour Simple Moving Average (SMA), a bearish signal that suggests the short-term trend is firmly controlled by sellers. While bulls are attempting to defend the $1.100 support zone, the formation of a bearish trend line on the hourly chart—with resistance looming at $1.120—indicates that the path of least resistance remains to the downside.
Chronology of the Recent Downtrend
The timeline of the recent price action reveals a swift transition from optimism to caution.

- The Peak: XRP reached a local high of approximately $1.1862, bolstered by a wave of market-wide buying pressure.
- The Resistance Test: As the price approached the $1.1550 level, it encountered significant selling volume. Despite multiple attempts to hold this area, the buying pressure proved insufficient to sustain the rally.
- The Breakdown: The failure to hold $1.1550 triggered a cascade of sell orders. Within a short window, the asset fell through the $1.150 and $1.1420 support levels, confirming a shift in market sentiment.
- Current State: As of the latest market analysis, the price is hovering around $1.1100, struggling to break above the $1.120 resistance. The hourly MACD is losing momentum in the bearish zone, and the Relative Strength Index (RSI) remains below the neutral 50 level, reinforcing the notion that buyers are currently sidelined.
Supporting Technical Data and Analysis
A deeper dive into the technical indicators paints a complex picture for XRP traders. The 100-hourly SMA acts as a significant overhead ceiling, currently situated slightly above the $1.1350 mark. For a bullish reversal to occur, the price must not only clear this moving average but also overcome the descending trend line forming on the hourly charts.
The Fibonacci Perspective
The current retracement levels are critical. The 76.4% Fibonacci level, calculated from the $1.050 to $1.1862 move, aligns closely with the $1.080 support zone. This level is widely considered the "line in the sand" for many traders. Should the price close decisively below this level, it would likely invalidate the bullish structure that has been building over the past week, potentially exposing the asset to a retest of the $1.050 base or even lower.
Volume and Momentum
The volume profile accompanying the recent decline has been relatively consistent, suggesting that the selling pressure is broad-based rather than a result of a single "whale" exit. With the RSI remaining below 50, the lack of buying momentum suggests that the market is waiting for a clear catalyst before initiating a new position.
Implications for Investors and Traders
The current volatility carries significant implications for those exposed to XRP. For long-term holders, the current price action is a test of conviction. Historically, XRP has shown a tendency to undergo sharp, volatile corrections before finding a bottom and consolidating for a new leg upward.
For active traders, the scenario is different. The lack of clear support above $1.10 suggests that "buying the dip" carries significant risk until a reversal pattern—such as a double bottom or a bullish divergence on the RSI—is confirmed.
Potential Scenarios
- The Bullish Recovery: Should buyers successfully defend the $1.100 mark and break the $1.120 trend line, the immediate target for the bulls would be $1.1350. A break above this would open the door for a retest of $1.1420, followed by the significant $1.1550 resistance.
- The Bearish Continuation: Failure to hold $1.100 will likely bring the $1.080 support into play. A breach of this level would likely accelerate the descent toward $1.0650 and $1.050. Should the $1.050 support fail, the psychological $1.000 barrier becomes the next logical destination for a potential sell-off.
Expert Perspectives on Market Volatility
Market experts often highlight that periods of "sideways" or "downward" movement are essential for the long-term health of an asset. By shaking out leveraged positions and resetting overbought indicators (like the RSI), the market creates a more sustainable base for future growth.
Aayush Jindal, a veteran market analyst, notes that technical indicators are only part of the equation. "In the world of cryptocurrency, price action is rarely dictated by charts alone," Jindal observes. "Macroeconomic factors, regulatory updates regarding the Ripple ecosystem, and broader liquidity flows within the crypto market all contribute to the volatility we are seeing. Traders should focus on managing their risk exposure and avoiding the urge to chase price movements during periods of low volume."
Navigating the Market: Risk Management Strategies
In such uncertain conditions, the importance of a disciplined trading strategy cannot be overstated. Investors are advised to:
- Use Stop-Loss Orders: Given the proximity of major support levels, setting automated stop-losses can help protect capital from sudden, unexpected volatility.
- Monitor Correlation: XRP often tracks the movements of Bitcoin and Ethereum. Keeping a close eye on the BTC/USD pair is essential, as a sudden surge or crash in Bitcoin often dictates the direction of the broader altcoin market.
- Conduct Independent Research: Market analysis, including this report, should serve as a starting point. Investors should always consider their own risk tolerance and investment horizons before making decisions.
Conclusion
XRP is currently in a defensive posture, grappling with technical resistance and a cooling market environment. While the immediate outlook is bearish, the ability of the asset to hold the $1.100 and $1.080 support levels will be the defining factor in the coming days. Investors should remain vigilant, keep a close watch on the hourly RSI and MACD, and prepare for continued volatility as the market seeks a new equilibrium. As always, the path forward in the crypto market is paved with uncertainty, and only those who maintain a disciplined approach to risk management will be best positioned to navigate the challenges ahead.
Disclaimer: The information provided in this article is for educational and informational purposes only and does not constitute financial, investment, or trading advice. Cryptocurrency investments are inherently volatile and carry a high degree of risk. Readers are encouraged to conduct their own thorough research and consult with a qualified financial advisor before making any investment decisions. The author and the publisher assume no responsibility for any losses or gains resulting from the use of this information.
