
Overview: The Current Landscape for Solana
Solana (SOL), once a high-flying favorite among decentralized finance (DeFi) enthusiasts and institutional investors alike, is currently navigating a precarious technical landscape. Following a failed attempt to maintain price stability above the $67 threshold, the asset has entered a period of corrective volatility. This downturn reflects a broader trend observed across the cryptocurrency market, with major assets like Bitcoin and Ethereum also struggling to sustain recent momentum.
As of the latest market data, Solana has drifted below both the $66 and $65 support levels, signaling a transition into a short-term bearish phase. For traders and investors, the current price action serves as a critical junction: either the asset finds immediate footing to reclaim higher ground, or it risks a deeper retracement toward significant psychological support zones.
Chronology of the Recent Decline
The downward shift in Solana’s valuation did not occur in a vacuum. To understand the current position, one must examine the progression of the last few trading sessions.
The Failed Breakout
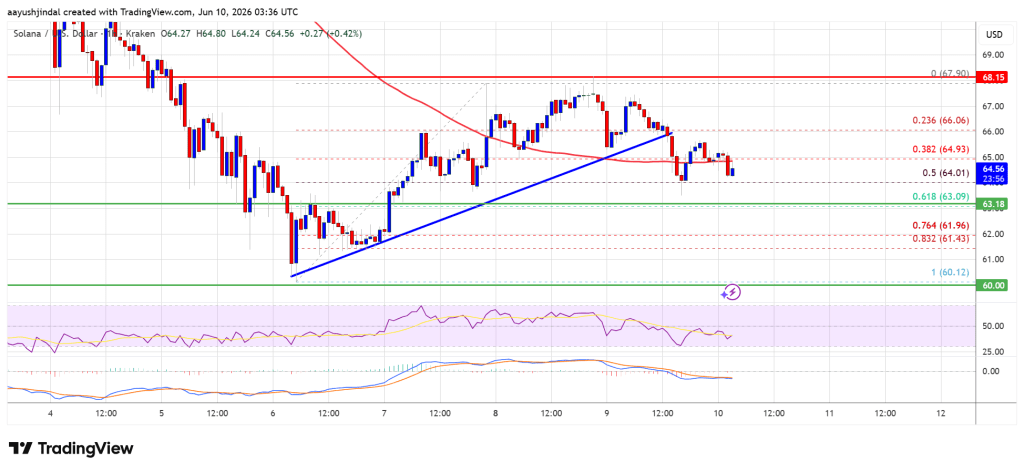
Solana’s recent bullish momentum saw the price climb to a swing high of $67.90, rising from a solid base of $60.12. During this period, market sentiment was buoyed by optimistic volume and positive sentiment across the layer-1 blockchain ecosystem. However, the inability to consolidate gains above the $67 mark acted as a catalyst for a technical breakdown.
The Breakdown of Trend Lines
As selling pressure mounted, SOL slipped below a critical bullish trend line that had been supporting the hourly chart. This break was accompanied by a move below the 50% Fibonacci retracement level (calculated from the $60.12 low to the $67.90 high). Once this technical floor was breached, the price accelerated its slide, ultimately testing the $63.20 support level. The speed of this correction caught many short-term speculators off-guard, forcing a liquidation of long positions and further exacerbating the downward momentum.

Supporting Data: Technical Indicators
The current technical state of Solana is defined by several key metrics that traders are monitoring closely.
Moving Averages and Price Action
Solana is currently trading below its 100-hour simple moving average (SMA). This is a classic bearish signal, indicating that the immediate trend is controlled by sellers rather than buyers. The 100-hour SMA now acts as a dynamic resistance point, which the price must clear if it intends to invalidate the current downtrend.
Oscillators: MACD and RSI
- Hourly MACD: The Moving Average Convergence Divergence (MACD) for the SOL/USD pair is currently gaining pace within the bearish zone. The divergence between the signal line and the histogram suggests that the downward momentum is not yet exhausted, requiring caution from those looking to "buy the dip."
- Hourly RSI: The Relative Strength Index (RSI) is currently hovering below the 50 neutral mark. This indicates that the asset is neither overbought nor oversold, but is trending toward bearish territory, providing room for further declines before the market considers the asset "oversold."
Fibonacci Retracement Levels
The 61.8% Fibonacci retracement level of the most recent upward wave sits near $63.10. This level is currently being tested as a major support zone. A definitive close below this level would likely confirm a shift in market structure, opening the doors for a retest of the $62.20 and $60.00 levels.
Market Implications: What Lies Ahead?
The market is now bifurcated between two potential scenarios for Solana in the coming days.
Scenario A: The Bullish Rebound
For the bulls to reclaim control, Solana must first establish a base above the $63.00 mark. A successful defense of this level could lead to a relief rally. The primary objective for buyers will be overcoming the $65.00 resistance level, followed by the more significant hurdle at $66.00. If the asset can secure a daily close above the $67.20 resistance zone, it would invalidate the current bearish narrative and potentially set the stage for a push toward the $68.00 and $70.00 targets.
Scenario B: The Continued Bearish Slide
Should the bears remain in control and force a breach of the $63.10 and $62.20 support levels, the technical outlook darkens considerably. The $60.00 zone acts as the next major psychological barrier. A failure to hold $60.00 could trigger a cascade effect, with technical analysts eyeing the $55.00 support level as the next logical destination for a short-term correction.
Broader Market Context and Expert Perspectives
Solana’s price action is deeply interconnected with the performance of the wider crypto market. As senior market expert Aayush Jindal notes, technical analysis is not about predicting the future with certainty, but about identifying high-probability zones for risk management.
In the context of the current crypto market, Bitcoin and Ethereum serve as the bellwethers. When these assets experience "stumbles" near major resistance levels, altcoins like Solana often experience amplified volatility. Solana’s specific challenges—balancing its high throughput network demands with market sentiment—make it particularly sensitive to these broader shifts.
The interplay between technical indicators and macro-economic sentiment is a recurring theme in the digital asset space. While Solana continues to demonstrate robust network activity, the price of the token remains heavily influenced by the flow of speculative capital and the overall risk-on or risk-off sentiment in the financial markets.
Summary of Key Levels
For those tracking the asset, keeping an eye on the following levels is essential for formulating a strategy:
- Key Resistance Levels: $65.00, $66.00, $67.20, $68.00.
- Key Support Levels: $63.10, $62.20, $60.00, $55.00.
Conclusion: Strategic Caution
The current state of Solana is a reminder of the inherent volatility in the cryptocurrency sector. While the blockchain continues to evolve, the price of SOL is currently locked in a struggle between buyers looking for a recovery and sellers aiming to capitalize on the recent failure to break resistance.
Investors should prioritize risk management, utilizing stop-loss orders and keeping a close watch on the hourly RSI and MACD indicators for signs of a trend reversal. Whether the asset consolidates near $63 or drops toward $60, the coming sessions will provide the necessary data to determine the next major trend.
Disclaimer: The information provided in this article is for educational and informational purposes only. It does not constitute, and should not be construed as, financial, investment, or trading advice. Cryptocurrency investments are subject to significant market risks, including the total loss of principal. NewsBTC and its contributors do not recommend buying, selling, or holding any specific cryptocurrency. Readers are strongly encouraged to conduct their own independent research and consult with a qualified financial advisor before making any investment decisions. All trading activities are performed entirely at your own risk.
