
The cryptocurrency market is currently witnessing a high-stakes standoff involving XRP, the digital asset native to the XRP Ledger. Following a period of aggressive sell-offs that rattled investor confidence, XRP bulls are attempting to transition from a simple relief bounce into a more substantial, sustained recovery. Market analysts are closely watching a potential three-part impulse structure emerging from the recent lows of approximately $1.05 to $1.07. However, whether this technical setup will materialize into a full-blown trend reversal remains contingent on the asset’s ability to reclaim critical price levels that were lost during the recent market crash.
The Chronology of the Correction: Mapping the "W-X-Y" Sequence
To understand the current positioning of XRP, one must examine the macro corrective sequence that has defined the asset’s price action over the past year. Since hitting highs above the $3 mark, XRP has been locked in a classic Elliott Wave pattern—a "W-X-Y" double zigzag that has consumed months of market history and tested the resolve of long-term holders.
Phase 1: The Wave W Decline
The sequence began with a pronounced downward trajectory. The first leg, identified as Wave W, unfolded as a complete A-B-C decline. This phase saw consistent selling pressure, culminating in a significant structural low labeled (C)/(W) on various technical charts. This floor was firmly established in early February, serving as a critical support foundation for subsequent market movements.
Phase 2: The Linking Wave X
Following the February bottom, the market experienced a period of stabilization and corrective growth. A linking wave, designated as Wave X, initiated a counter-rally. By mid-May, this momentum pushed XRP prices above the $1.50 threshold. This phase was characterized by an internal (X)-(A)-(B) sequence, reflecting a period of speculative optimism. However, the rally proved unable to sustain its momentum, eventually rolling over as demand waned and bearish sentiment re-entered the ecosystem.
Phase 3: The Current "Y" Leg
The current market environment is defined by the final leg of this corrective sequence: Wave Y. This phase has effectively retraced the gains made in the spring, dragging XRP back down to the $1.10–$1.12 range. This current zone represents a "make-or-break" moment for the bulls. At the time of writing, the asset is hovering in a precarious state, with traders and analysts alike scrutinizing the volume and velocity of the price action to determine if the bottom is truly in or if further downside is imminent.
Technical Analysis: The Proposed Three-Part Impulse
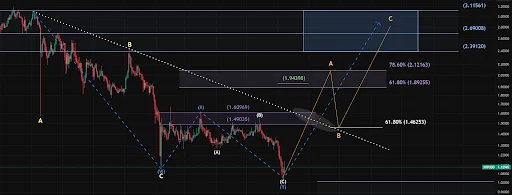
Market observers, including prominent analysts on social media platforms like X (formerly Twitter), have highlighted a bullish roadmap for XRP that pivots on the current $1.07 level. The projected path suggests an impulsive recovery structure consisting of three distinct waves (A-B-C) that could propel the price toward a target zone between $2.39 and $3.11.
Wave A: The Initial Push
The first stage of this recovery, Wave A, is projected to target the $2.12 level. While this represents a significant upside from current levels, the path is fraught with technical hurdles. Before reaching $2.12, the price must contend with a key support-turned-resistance trendline situated at $1.46. Successfully converting this level back into support is the prerequisite for any sustained bullish momentum.
Wave B: The Tactical Retracement
Following the potential peak of Wave A, analysts anticipate a tactical pullback—Wave B. In technical theory, this retracement serves to shake out weak hands and re-test the underlying demand. The model suggests a drop back toward the $1.46 zone. Crucially, investors are cautioned not to interpret this decline as a return to bearish dominance; rather, it is viewed as a healthy consolidation phase before the final leg of the impulse.
Wave C: The Final Surge
Wave C represents the most aggressive phase of the projected recovery. Analysts anticipate this leg will be characterized by higher volume and increased buying interest, driving the price into a target box between $2.70 and $3.10. A clean breakout above the $3.10 resistance would serve as a macro-confirmation, signaling that the corrective phase is over and that the asset is positioning itself for a new all-time high trajectory.

Supporting Data and Market Sentiment
The current setup for XRP is not occurring in a vacuum. It is supported by a confluence of trading interest and macro-economic factors that suggest a high degree of market engagement.
Trading Volume and Liquidity
Data from various exchange aggregators indicates a surge in "trading interest" despite the price volatility. When volume rises in tandem with a bounce from support, it often signals institutional re-accumulation. Conversely, periods of low volume during a recovery phase are typically viewed as red flags, suggesting that the rally is driven by retail speculation rather than institutional commitment.
The "Bottoming" Debate
The debate over whether $1.05 represents the absolute bottom remains a primary focus of financial discourse. While the impulsive setup suggests a bullish reversal, analysts are keeping a watchful eye on the downside. If XRP fails to hold its current momentum and experiences a rejection at the upper resistance bands, the technical outlook could shift significantly.
Several analysts have noted that if the current impulse fails, a secondary correction could drive the price toward the $0.75 to $0.92 range. This region has been identified as a "macro wave 2" bottom target by various experts, providing a strong safety net for long-term investors who view the current volatility as a discount opportunity.
Implications for the XRP Ecosystem
The potential move toward $3 is more than just a chart pattern; it carries significant implications for the broader XRP ecosystem and its utility-based adoption.
The Regulatory and Institutional Context
XRP’s price action has historically been sensitive to developments regarding Ripple’s legal standing and its integration into global financial systems. As Ripple continues to expand its cross-border payment solutions, the market is looking for a correlation between utility growth and price appreciation. A successful move toward the $3 level would likely be interpreted as a validation of the asset’s long-term utility proposition, potentially attracting further interest from traditional financial institutions.
Investor Strategy and Risk Management
For the average investor, the current technical setup presents a classic dilemma: the "risk-reward" profile of entering at current prices.
- The Bullish Case: Entering at $1.10 with a target of $3.00 offers a compelling risk-reward ratio, provided the stop-loss is placed beneath the $0.90 support level.
- The Bearish/Conservative Case: Waiting for a confirmed breakout above the $1.46 resistance trendline may provide a higher degree of certainty, albeit at a higher entry price.
Conclusion: A Critical Juncture
XRP stands at a critical juncture in its market cycle. The transition from a prolonged corrective phase to a three-part impulsive recovery is technically possible but fundamentally demanding. While the charts shared by experts suggest a clear path toward the $3 region, the cryptocurrency market is notoriously prone to "fake-outs" and sudden shifts in sentiment.
As the market continues to process the current price action, traders should prioritize technical confirmation over speculative hope. Whether XRP can reclaim its lost territory or is destined for a deeper retest of support will depend on the strength of demand at the $1.46 and $2.12 hurdles. For now, the bulls are holding the line, but the burden of proof remains on them to force a clean break through the overhead resistance and validate the macro-bullish thesis. As always, investors are advised to monitor volume, maintain rigorous risk management, and stay informed on the evolving regulatory landscape that continues to shape the future of XRP.
