
The cryptocurrency market is currently witnessing a period of heightened volatility, with XRP, the native digital asset of the Ripple ecosystem, finding itself at a critical technical juncture. Following a failed attempt to maintain a position above the $1.150 psychological threshold, the asset has entered a corrective phase, mirroring broader market weakness seen in major assets like Bitcoin and Ethereum. As of the latest trading sessions, XRP is exhibiting distinct bearish signals, leaving market participants and technical analysts questioning whether the current dip is a temporary consolidation or the precursor to a deeper retracement.
The Anatomy of the Current Correction
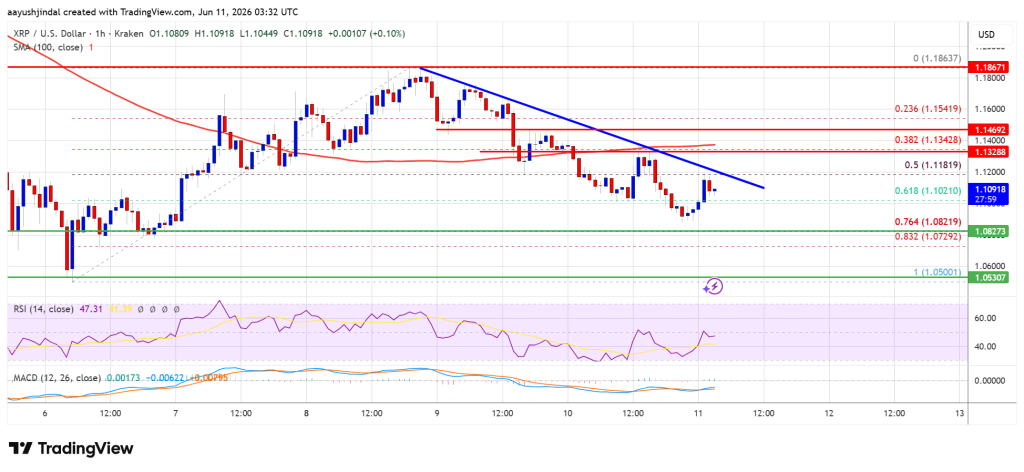
The recent price action for XRP has been characterized by a struggle to maintain upward momentum. After hitting a swing high of approximately $1.1862, the asset faced significant selling pressure, leading to a steady decline that pushed the price below the $1.150 and $1.1420 support levels.
From a technical standpoint, this decline is particularly notable because it breached the 50% Fibonacci retracement level, which was calculated based on the previous upward move from the $1.050 swing low. This breach serves as a cautionary signal to traders, as it often suggests that the previous bullish trend is losing structural integrity.
Currently, the price is navigating a precarious environment. XRP is trading below both the $1.1350 resistance mark and the 100-hourly Simple Moving Average (SMA). The presence of a bearish trend line on the hourly chart, which currently caps gains near $1.120, acts as a primary obstacle for bulls attempting to stage a recovery. Without a decisive breakout above this trend line, the path of least resistance remains skewed to the downside.

Chronology of the Recent Market Shift
To understand the current state of XRP, it is essential to look at the sequence of events that led to the present market sentiment:
- The Peak Phase: XRP initially showed resilience, riding a wave of positive sentiment that drove it toward the $1.186 range. During this period, the asset saw increased volume and heightened interest from retail and institutional participants alike.
- The Resistance Rejection: Upon reaching the $1.1862 peak, the asset encountered heavy resistance. Market participants began to lock in profits, triggering the initial wave of selling.
- The Support Breach: The failure to hold $1.1550 served as a catalyst for a more pronounced sell-off. As the price slipped below $1.150, stop-loss orders were likely triggered, accelerating the downside move toward the current $1.10 support zone.
- The Current Consolidation: Bulls are currently attempting to defend the $1.10 region. This area is vital; if it fails, the technical landscape for XRP becomes significantly more grim, potentially opening the door for a retest of the $1.05 floor.
Technical Indicators: A Bearish Outlook
Technical analysis provides a granular view of why market sentiment has turned sour. The Hourly MACD (Moving Average Convergence Divergence) is currently showing signs of losing pace within the bearish zone, indicating that selling pressure is still prevalent despite the minor consolidation.
Furthermore, the Relative Strength Index (RSI) for the XRP/USD pair has dipped below the 50 neutral level. In technical circles, an RSI below 50 is generally interpreted as a bearish signal, suggesting that the momentum is favoring sellers. Unless the RSI can reclaim the 50 level and move toward overbought territory, the probability of a sustained recovery remains low.
Key Support and Resistance Levels
For traders and investors monitoring the market, the following levels are critical to watch:
Immediate Resistance
- $1.120: This is the primary hurdle. It aligns with the current bearish trend line on the hourly chart. A break here is the first requirement for any bullish reversal.
- $1.1350: A secondary resistance level. Clearing this would indicate that buyers are regaining control and could lead to a test of the $1.1420 mark.
- $1.1550: A major resistance level that previously acted as a base. Reclaiming this would signal a return to the bullish structure seen earlier in the week.
Critical Support
- $1.1000: The current defensive line. Bulls must hold this level to prevent a further slide.
- $1.080: A significant psychological and technical support. It corresponds to the 76.4% Fibonacci retracement level of the move from $1.050 to $1.1862.
- $1.050: The ultimate support level. A breakdown below this could trigger a larger capitulation event, with potential targets at $1.020 and the $1.00 psychological round number.
Implications for the Broader Ripple Ecosystem
The performance of XRP is often viewed as a barometer for the broader Ripple ecosystem. While the current price action is largely technical in nature, it has broader implications for market confidence.
When XRP underperforms, it often leads to a cooling of interest in the underlying utility of the Ripple network. Conversely, a sustained rally can often bring increased liquidity and developer interest to the ecosystem. Investors are currently waiting for a catalyst—either in the form of macro-economic news or specific developments within the Ripple legal and partnership landscape—that could provide the necessary volume to break the current bearish trend.
Managing Risk in a Volatile Environment
Given the current technical setup, market participants are advised to exercise extreme caution. The crypto market is notoriously sensitive to sudden shifts in sentiment, and the current "red" trend in XRP is a reminder of the inherent risks.
For those holding positions, it is essential to have a clear risk management strategy. This includes setting stop-loss orders below key support levels and avoiding the temptation to "catch a falling knife" during sharp sell-offs. For those looking to enter the market, waiting for a confirmed break above the $1.1350 resistance level may offer a more favorable risk-to-reward ratio than buying into the current uncertainty.
Conclusion: What to Expect Next
The near-term outlook for XRP remains tilted toward the downside as long as the price remains trapped below the $1.1350 resistance. The struggle to maintain the $1.10 support suggests that the market is currently in a state of indecision, with sellers holding the slight upper hand.
Investors should keep a close eye on the hourly charts over the next 24 to 48 hours. If the price fails to break the $1.120 trend line, a retest of the $1.080 support level is increasingly likely. Should that level also give way, the bears may gain the momentum required to push the price toward the $1.050 base.
While volatility is an expected feature of the cryptocurrency landscape, the current technical structure of XRP serves as a reminder of the importance of disciplined analysis. As the market continues to evolve, staying informed about technical indicators and maintaining a strict adherence to risk management protocols will remain the most effective tools for navigating these turbulent waters.
Disclaimer: The information provided in this article is for educational purposes only and does not constitute financial advice. Investing in cryptocurrencies involves significant risk. Always conduct your own research and consult with a professional financial advisor before making any investment decisions.
